


We have covered major measures of center and location—mean, median, and mode—we now turn to other important measures: percentiles and quartiles. These measures divide a dataset into equal parts, offering deeper insights into the distribution and spread of data. Percentiles, such as the 25th percentile or the median (50th percentile), indicate the value below which a certain percentage of observations fall. Quartiles divide the dataset into four equal parts, each containing 25% of the data.
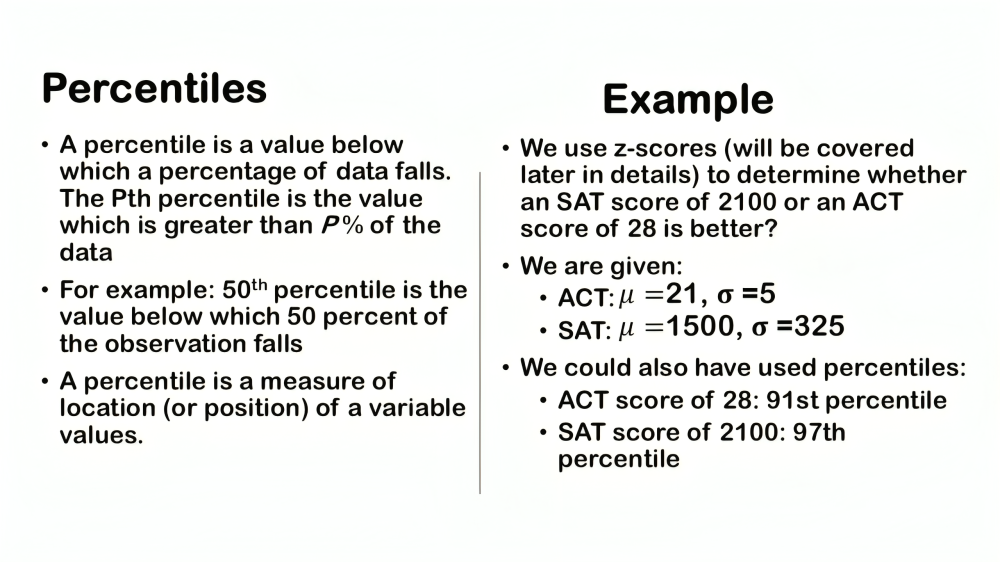
Let’s delve into the concept of percentiles, which are crucial in understanding the distribution of data and measuring relative positions within a dataset. A percentile simply indicates the value below which a certain percentage of data points fall.
For instance, if we talk about the 30th percentile of a dataset, it signifies the value below which 30% of the observations lie. Similarly, the 50th percentile, known as the median, indicates the point below which half of the dataset’s values are located.
Percentiles are widely used in various contexts, such as academic exams. For example, in CAT exams, if someone achieves a 98th percentile, it means that they have performed better than 98% of all test-takers. This percentile score provides a clear indication of their relative performance compared to others.
Calculating percentiles manually can sometimes be complex, especially with large datasets or non-standard distributions. Hence, in practice, most analysts and researchers rely on statistical software to compute percentiles accurately and efficiently.
Understanding percentiles allows us to grasp the distribution of data points and their relative positions within a dataset. Whether analyzing exam scores, income levels, or other metrics, percentiles provide valuable insights into where an individual or observation stands in relation to the broader dataset.
Quartiles
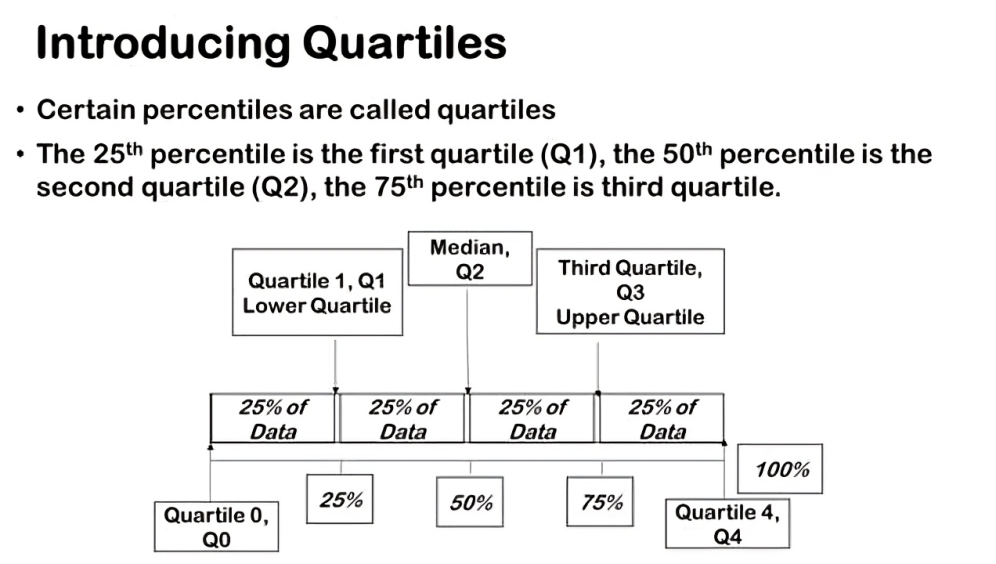
Quartiles is another important measure that divides a dataset into four equal parts, each containing 25% of the data. Quartiles, are a specific type of percentiles that divide a dataset into four equal parts. For example, the 25th percentile corresponds to the first quartile. Dividing a dataset into four equal parts gives us three quartiles: the first quartile (25th percentile), the second quartile (50th percentile or median), and the third quartile (75th percentile).
Percentiles, such as the 50th percentile (median), indicate the point below which a certain percentage of data values lie. Quartiles are simply special percentiles that occur at specific data points within this distribution.
Understanding quartiles provides valuable insights into the distribution of data. The third quartile (75th percentile), for instance, indicates that 75% of the observations lie below this value. It helps us gauge the spread and variability within the dataset, providing a clearer picture of where values are concentrated.
Sometimes you’ll also see a reference to the fourth quartile as the quartile zero. those are simply the zeroth percentile and the hundredth percentile respectively. so quartile zero is the zeroth percentile quartile four is the hundredth percentile
It’s important to note that terms like median, 50th percentile, and second quartile all refer to the same value in a dataset. They represent the middle point where half of the data points fall below and half above, offering a central measure of the dataset’s distribution.
Understanding quartiles allows us to analyze data in larger segments, offering a clearer picture of the dataset’s distribution and variability. They are particularly useful when assessing the spread of data and identifying outliers or extremes within a dataset.
In statistical analysis, quartiles provide a structured approach to interpreting data, complementing percentiles by offering broader insights into how data is dispersed across its range. Whether examining exam scores, income levels, or other metrics, quartiles help researchers and analysts better understand the central tendencies and variability within the data.
Example: Quartile
Let’s delve into the marks data to understand its distribution using quartiles and specific percentiles. We’ve already explored the mean and the median (50th percentile), now let’s examine the quartiles to gain deeper insights.
The first quartile, also known as the 25th percentile, is 65 marks. This tells us that 25% of students scored below 65 marks. Moving to the second quartile, which aligns with the median, we find it’s at 75 marks. This means half of the students scored below 75 marks.
Next, the third quartile, or the 75th percentile, is at 90 marks. Here, 75% of students scored below 90 marks. These quartiles provide a structured view of how marks are distributed across the dataset, giving us a sense of the spread and central tendencies.
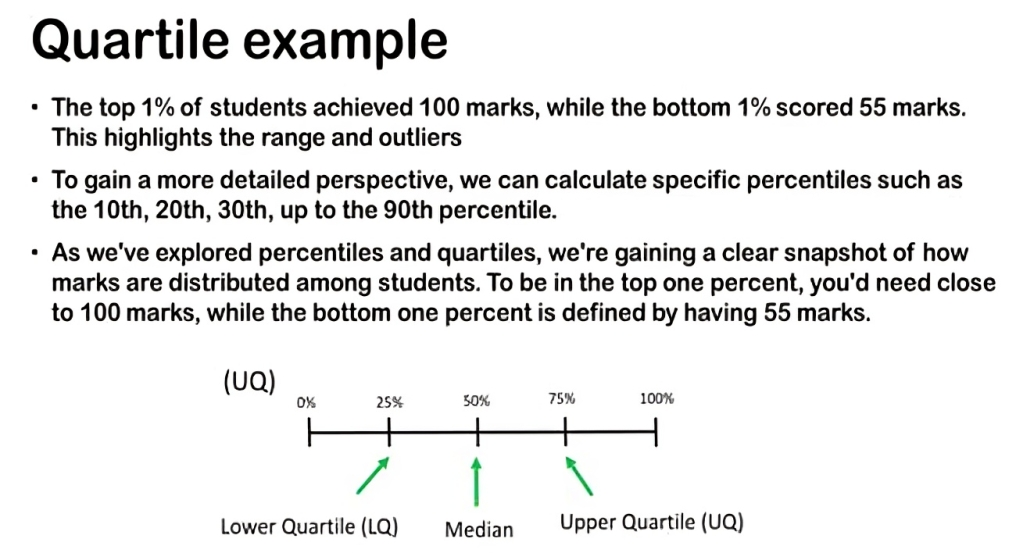
Now, let’s focus on extremes: the top 1% of students achieved 100 marks, while the bottom 1% scored 55 marks. This highlights the range and outliers within the dataset, showcasing the highest and lowest scores.
To gain a more detailed perspective, we can calculate specific percentiles such as the 10th, 20th, 30th, up to the 90th percentile. These percentiles allow us to zoom in on smaller chunks of the data, providing a nuanced understanding of how marks are distributed across different segments of the student population.
As we’ve explored percentiles and quartiles, we’re gaining a clear snapshot of how marks are distributed among students. To be in the top one percent, you’d need close to 100 marks, while the bottom one percent is defined by having 55 marks. It’s important to note that while these percentiles mark extreme values, they represent the same number of individuals—just as many students are in the top one percent as in the bottom one percent; the values simply differ.
Comments are closed.