


Imagine you’re a teacher assessing student performance in a math exam where scores range from 0 to 100. You’ve collected a dataset with each student’s name and their respective marks.
Using statistical software, we calculated the mean and median scores for the dataset. The mean score, averaging around 75, suggests the typical mark obtained across all students. However, it’s essential to note that the median score, approximately 68, is slightly lower than the mean.
The measures of central tendency, giving us a clear idea of where the median, mean, and mode lie within this set of observations. Additionally, we’ve examined measures of location or position, which tell us about the marks obtained by the bottom and top percentiles of this data set using percentile and quartile.
However, to get a complete picture, we also need to understand how varied or spread out these marks are. When analyzing marks, it’s not only useful to know the central tendency or location measures but also to grasp the extent of variation among students’ marks. This brings us to the concept of variation or variability in a set of observations.
Measures of variation, also known as measures of spread, dispersion, or variability, all refer to the same idea: assessing how spread out a set of data points is. While the mean, median, and mode provide information about a typical set of observations, they don’t reveal much about the dispersion or spread of the data.
Understanding the spread of marks can highlight how much scores deviate from the average, indicating whether most students have similar scores or if there’s a wide range of performance levels. This is crucial for educators to identify gaps and areas needing attention.
Measure of variation is measured through concepts like range, variance, and standard deviation, which will complement our understanding of central tendency by providing insights into the spread of data points within the marks dataset.
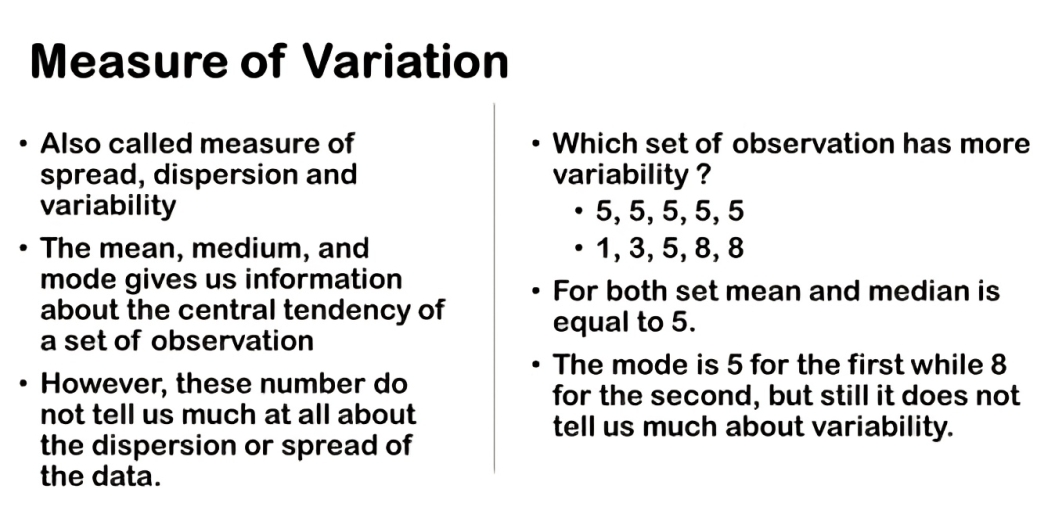
Let’s consider two small datasets to understand the concept of variability better. The first dataset consists of the number five repeated five times. The second dataset consists of the values one, three, five, eight, and eight.
Looking at these two sets of data, you might ask, “Which set of observations has greater variability? Which one is more spread out, and which one has more variation?” Most people would say that the second set of observations has more variability. The first set of observations has no variation because all the numbers are the same—it’s five repeated five times.
However, if we only look at measures of central tendency, we get a limited picture. For both of these datasets, the mean is five. The median, or the 50th percentile, is also five for both datasets. While the mode differs slightly, it still doesn’t provide much information about how spread out these two sets of observations are.
In essence, measures of central tendency like the mean, median, and mode tell us about the typical value in a dataset, but they don’t reveal the spread or variability of the data. To understand how varied or dispersed these sets are, we need to look at measures of variation or spread.
Comments are closed.