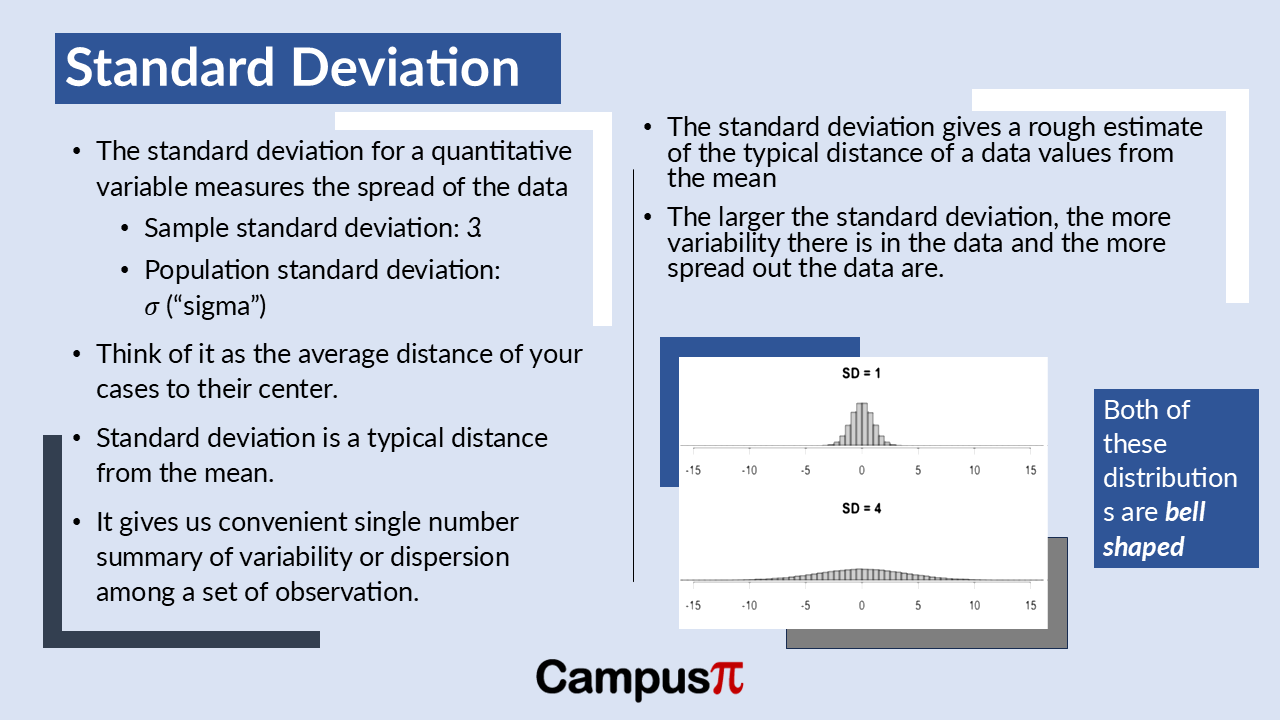
A straightforward solution to deal with unit of variance which is in squared units is to simply calculate the square root of the variance. Since variance is derived from squaring the deviations or distances from the mean, taking its square root reverses this process. Therefore, the square root of the variance gives us a measure of variation known as the standard deviation.

Key Takeaway
- Standard Deviation can be seen as the average distance from the mean for a set of observations, providing a measure of how spread out the data points are.
- The square root of the variance gives us a measure of variation known as the standard deviation.
- The significant advantage of the standard deviation is that it returns us the units in interpretable way for example rather than miles squares in case of variance, just miles.
- If we examine a dataset with less variability, both the variance and the standard deviation will be smaller.
- It helps convey the degree of variability in a dataset: the higher the standard deviation, the greater the variability of the observations around the mean.
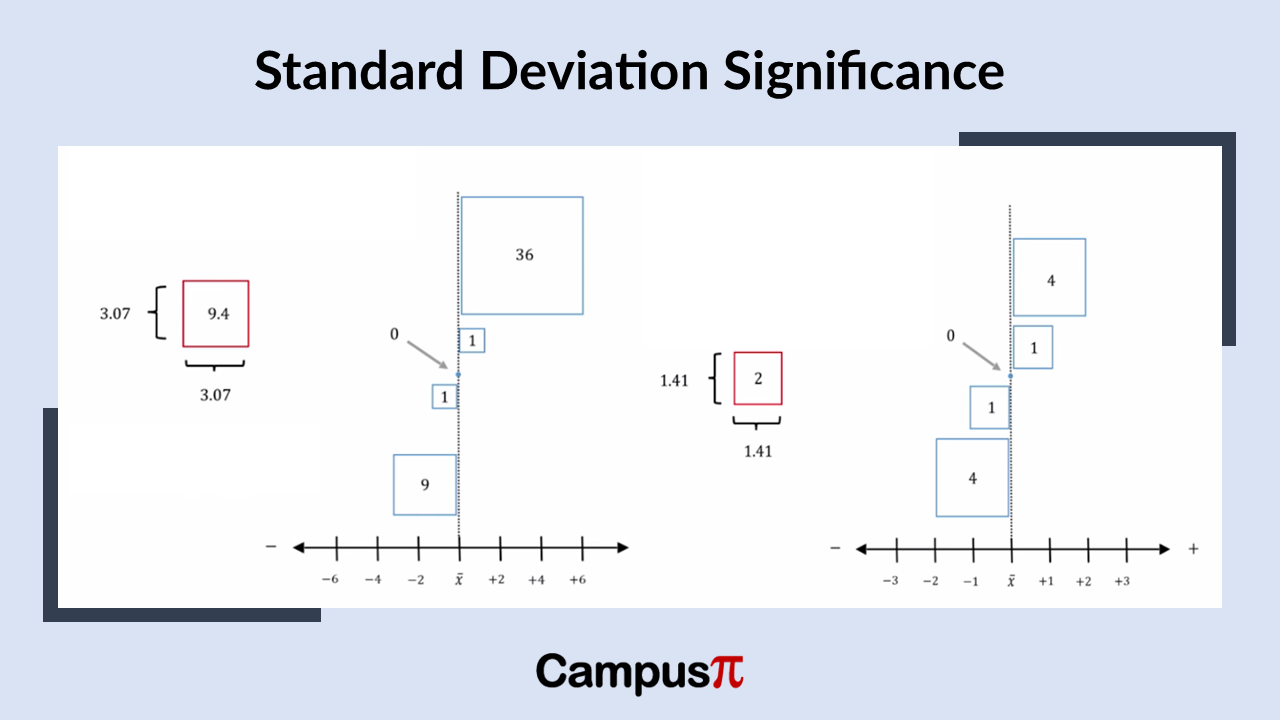
Let’s examine our dataset of one, two, three, four, and five, and consider the significance of the standard deviation. As mentioned earlier, the variance represents the typical size of the boxes that symbolize the squared deviations from the mean. To find the standard deviation, we simply take the square root of the variance. For a dataset where the variance is two, the standard deviation would be approximately 1.41.
The significant advantage of the standard deviation is that it returns us to our original units of measurement. For instance, if our dataset is in miles, the variance would be in square miles, whereas the standard deviation would be in miles, which is more intuitive for interpretation.
What does the standard deviation signify?

While the variance indicates the typical squared deviation from the mean, the standard deviation represents the side length of a typical box in our dataset. In this example, with a variance of two, the standard deviation of 1.41 can be seen as the length of one of these boxes. Squaring the standard deviation gives us the variance, demonstrating their mathematical equivalence. However, the preference for the standard deviation lies in its direct association with the original units of measurement, unlike the variance which is in squared units.
If we examine a dataset with less variability, both the variance and the standard deviation will be smaller. For example, in this dataset where the variance is 0.8, the square root of that variance, which is the standard deviation, is 0.9. In other words, the side length of our typical box in this dataset is 0.9. Therefore, the standard deviation of 0.9 reflects the smaller degree of variability present in these observations.
If we examine a dataset with greater variability, the variance will be larger. For instance, if the variance is 9.4, the typical square deviation from the mean is larger, roughly 3. Taking the square root of the variance gives us the standard deviation, which is approximately three.
Degree of variability
The standard deviation is simply the square root of the variance. A larger standard deviation, like one exceeding three, indicates a greater degree of variability in our dataset compared to a standard deviation below one. Thus, the total variability, represented by the variance and standard deviation, changes according to how spread out the data points are from the mean.
Let’s go back to dataset consisting of the values one, two, three, four, and five. These values have distances both above and below the mean. These distances are in their original form and haven’t been squared.
The standard deviation represents the side length of our typical box, which is the typical squared deviation from the mean. When we calculate the standard deviation for this dataset, we get a value of 1.41 units. This length reflects the measure of variability in our dataset.
The standard deviation, when compared to the actual distances or deviations in our dataset, appears quite typical—it’s neither the smallest nor the largest distance from the mean. It can be seen as the average distance from the mean for a set of observations, providing a measure of how spread out the data points are.
In statistical terms, the standard deviation is a clear indicator—it represents a typical deviation or distance from the mean. It helps convey the degree of variability in a dataset: the higher the standard deviation, the greater the variability of the observations around the mean. Unlike simpler measures like the range or interquartile range, both the standard deviation and variance take into account all observations in the dataset.
One of the strengths of the standard deviation is its ability to condense all this information about the observations into a single number, providing a concise summary of the variability or dispersion in the dataset.


