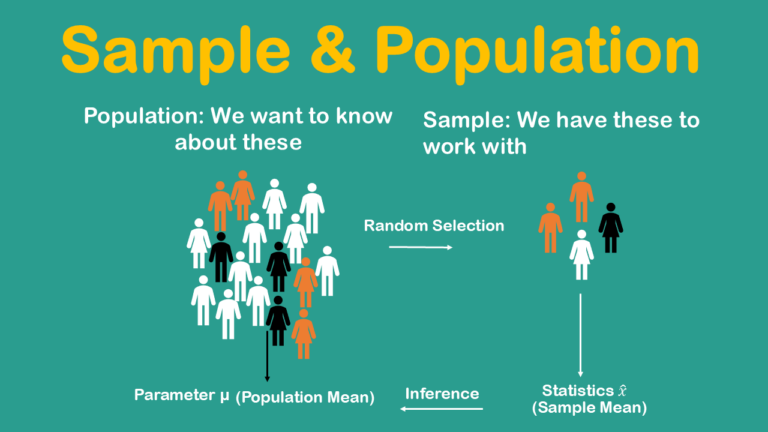
There is an important distinction between a sample of data and population of data. So, let’s take a research question example. Does taking aspirin relieve the pain among old age population in India? Another research question you might ask about meditation, does meditating 15 minutes each day improve happiness among college student in Beijing? In the previous question asked we have a population which is Population in India having headache. And there is also a target population which is all old age people, above 60 years of age taking aspirin in India.
Explanatory variable and response variable
Also, here we will have two kinds of variables in research study, if we are using one variable to help us understand or predict values of another variable, we call the former the explanatory variable and the later the response variable. If we want to measure how much motivation effect in getting good grades, then Academic motivation at the beginning of the school year is the explanatory variable, and GPA at the end of the school year is the response variable. In the same way if, the students want to use height to predict age; so, the explanatory variable is height and the response variable is age.
Population
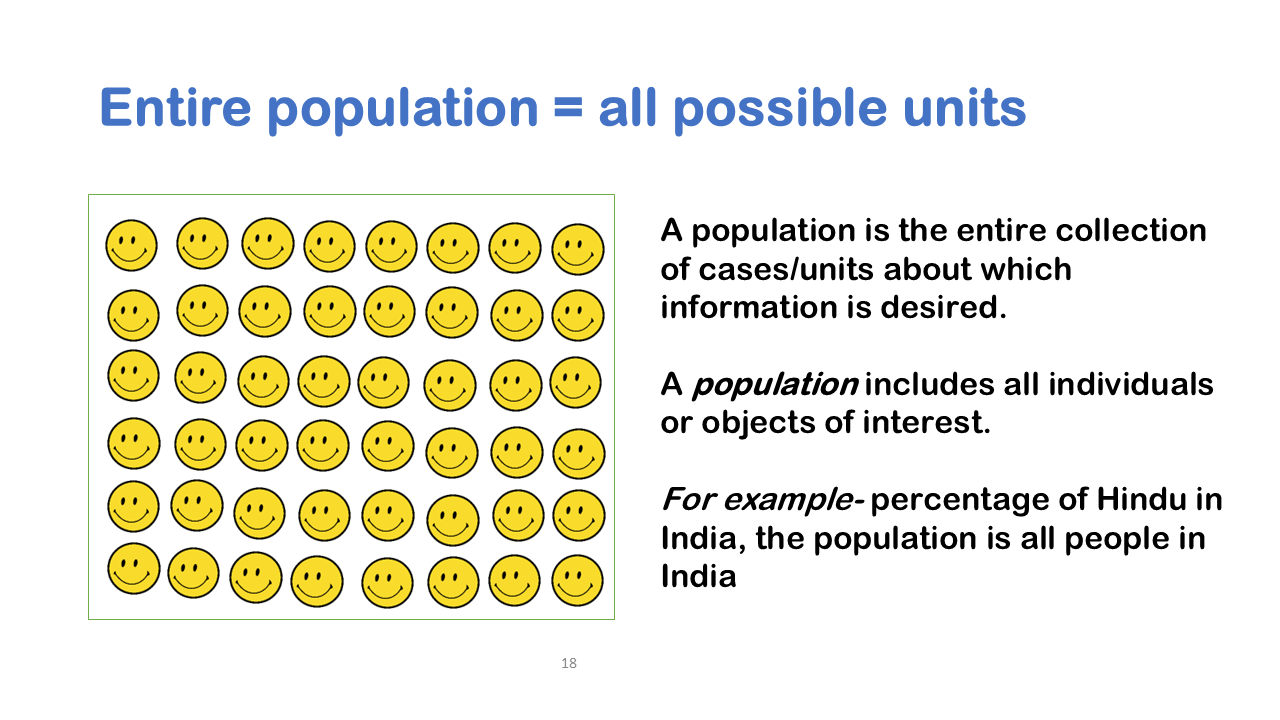
So, let’s talk about what a population is? A population is simply the entire collection of cases or observational units about which information is desired. So, each of these questions has a target population. In general, for population, you are talking about percentage of Buddhist in Japan, the population implied is the population of all people in Japan.
Target Population
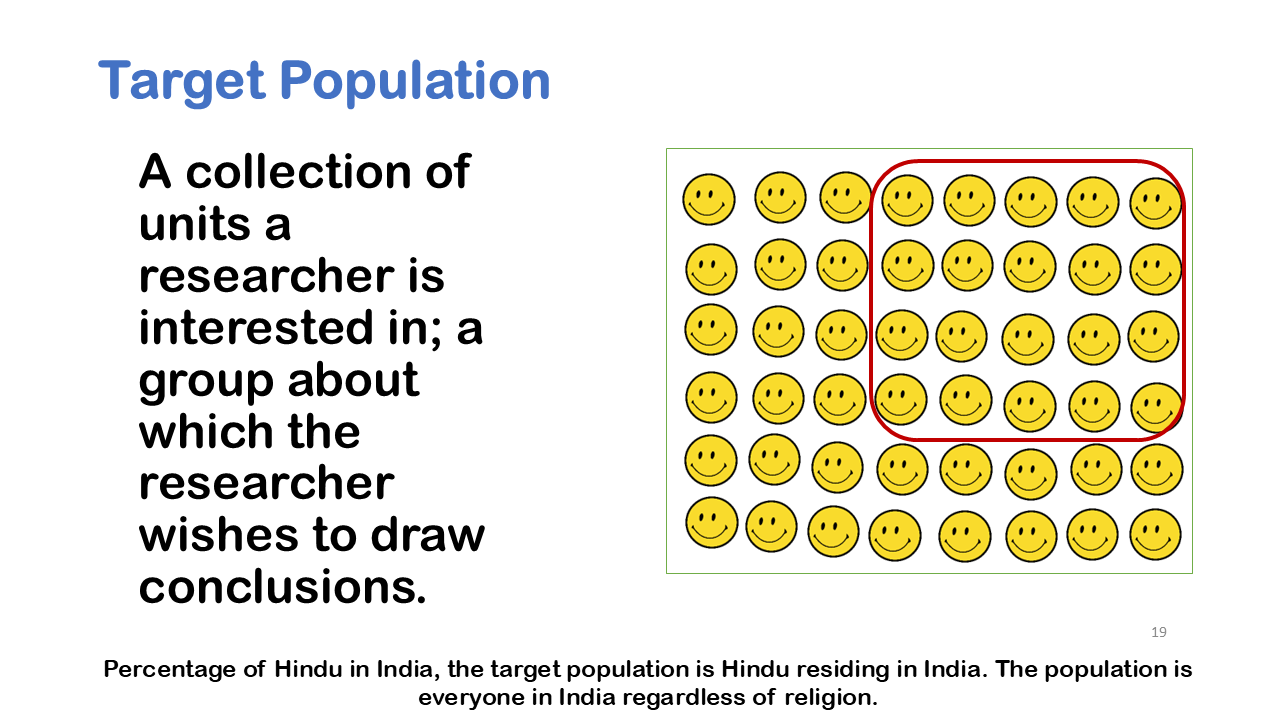
A target population is a collection of units a researcher is interested in; a group about which the researcher wishes to draw conclusions. So, let’s look at some research questions that we pose and let’s think about what is the population might be? So, when we ask what is the average number of words spoken daily among 10-year school children in Delhi? If you are linguist and you are asking that question your implicit target population is all 10-year-old children who attend school Delhi.
For another research question if you are sociologist and you want to know about legalising use of certain drug and what people in India think about approving or disapproving such a policy. The target population is all citizens of India. That is all people who live in India.
In the same way the third research question, of the meditation the target population implied is all college students in Beijing. These research question imply target population.
Launching Sports shoes for runners
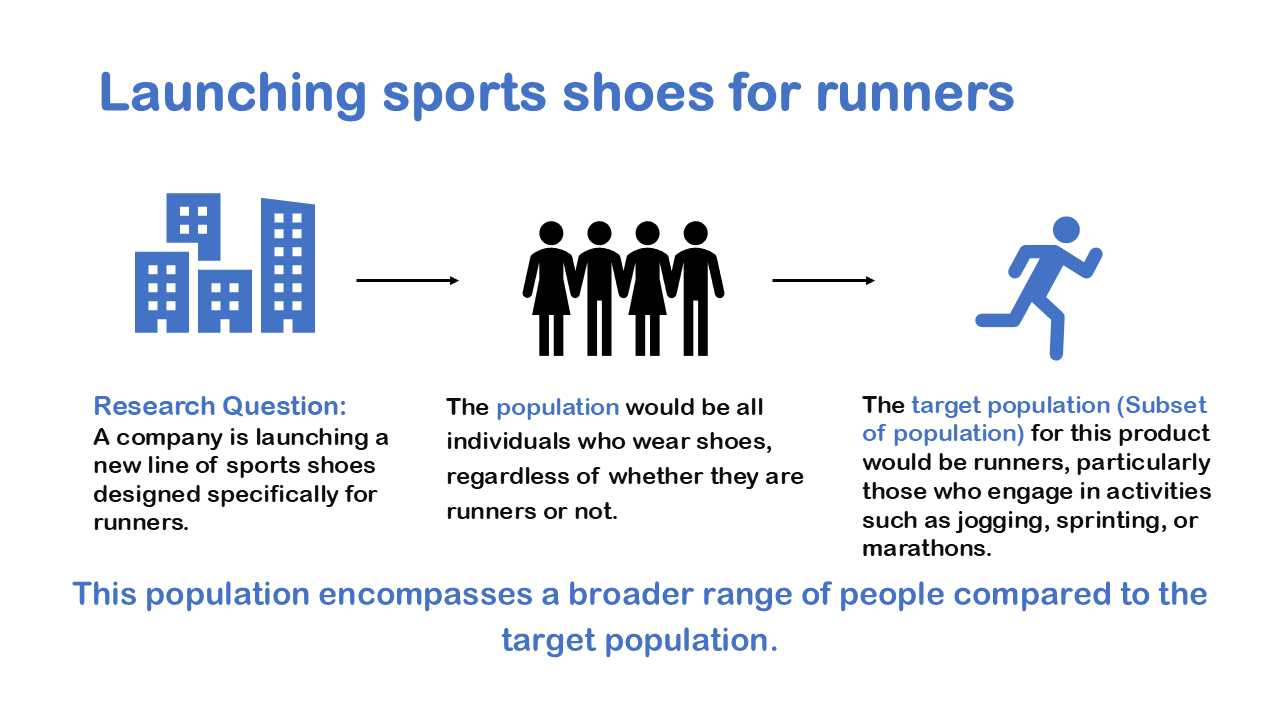
We take a final example to differentiate between population and target population. Suppose a company is launching a new line of sports shoes designed specifically for runners. Here the population would be all individuals who wear shoes, regardless of whether they are runners or not. And the target population (Subset of population) for this product would be runners, particularly those who engage in activities such as jogging, sprinting, or marathons. Also, it is useful to remember that the population encompasses a broader range of people compared to the target population.
Census
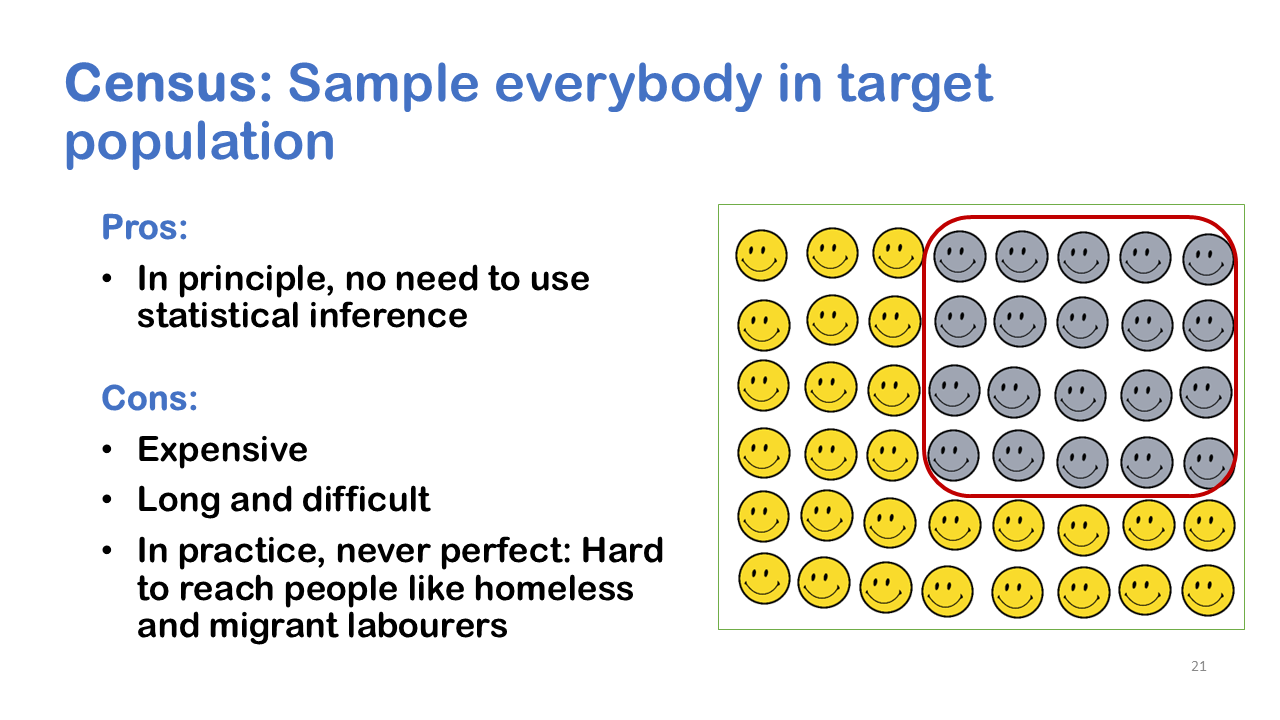
If a researcher wants to collect data on the entire population that is called conducting a census. Census have a long history, they have existed from centuries, they are existed for the purpose of empire building. A state or empire have collected information about all other citizens for collecting money for taxing them or try to encourage a population for reproduction because a growing population had led to a stronger empire. So, when you conduct census, you collect data on all people or cases in this case. The data collected could include name, gender, age birthplace and weapons that they kept in household.
There are few problems with a census as it is often difficult and expensive as you have to collect data on everybody. Especially hard to reach groups such as undocumented worker, homeless people. There are some ethical concerns with the census because when we collect data on people you are forcing everybody to participate, so there may be some ethical dilemma of violating one’s privacy. Suppose someone actually don’t want to participate but when conducted census you have to collect information on every individual. This is why many countries conduct census once in every 10 years. Because census is expensive, collecting data on everybody will cost a lot and its difficult.
Alternative to census: Sample
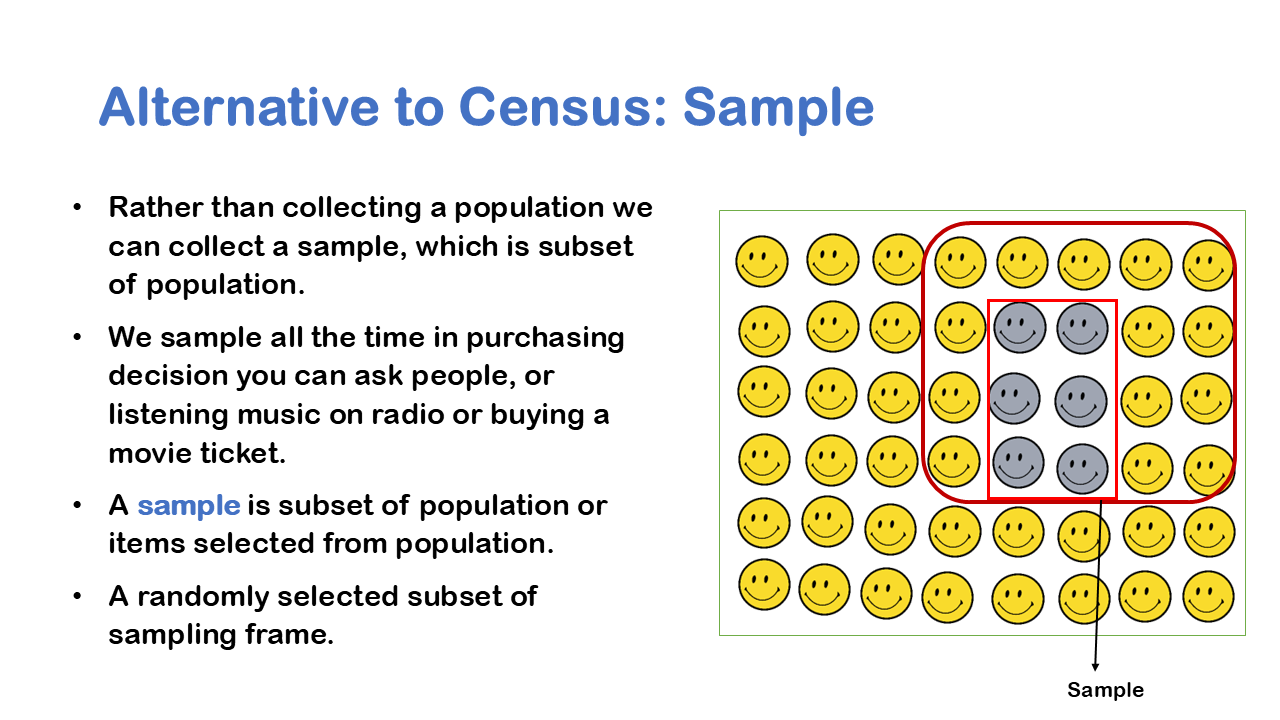
One solution an alternative to collecting a census is to collect a sample of the population. So here we have a population and a sample, and what we are doing is collecting a subset of that population. We take samples all the time, this is not what only statistician do, suppose you have a giant buffet with hundreds of different entrees, most people will try some subset of entrees before making a conclusion what to eat? So, you can might take chicken, or green beans just some sample of buffet and based on sample, you decide you really liked the green beans and not chickens, I am just going to have that for my meal.
When you listen to music you might scan few stations of the radio and really focus on one music, or when making decisions you might ask few people and make decisions or when buying things. The underline essence is sampling is pretty natural where you take sample of cases and you use that sample of cases to say something about a larger set of cases.
Sampling Steps
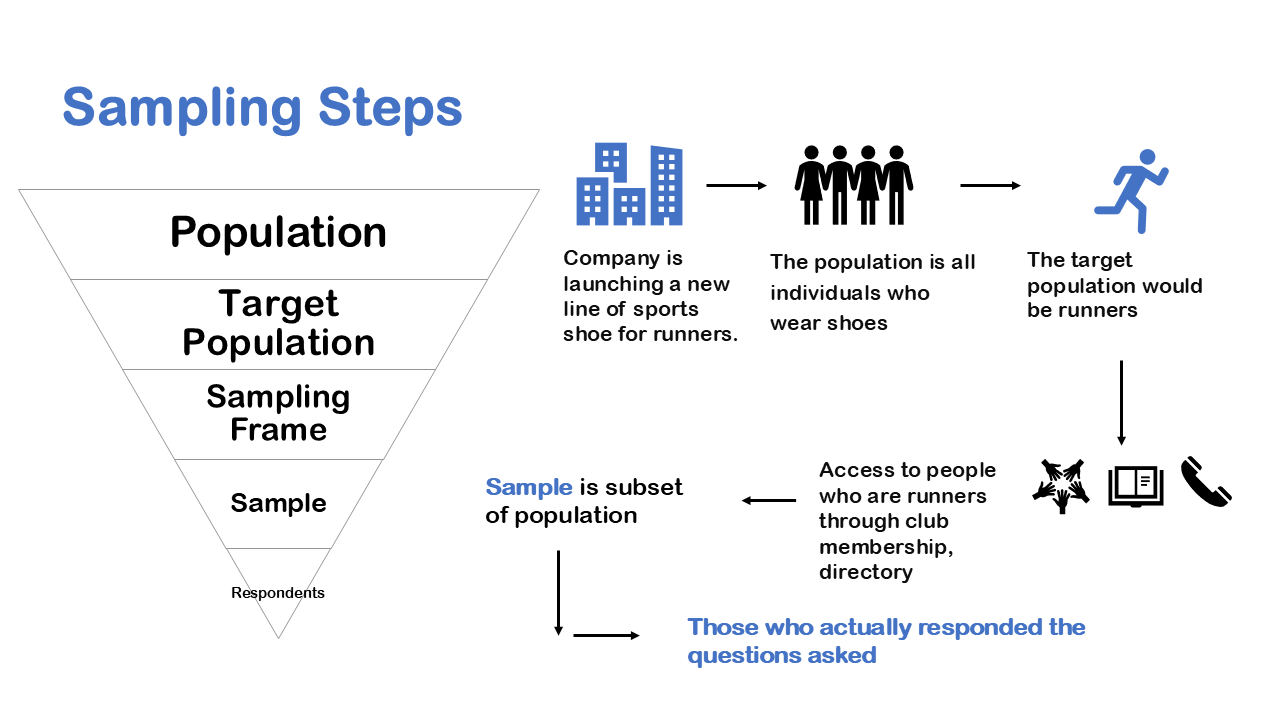
Let’s sum up the complete steps that we use to sample from a population. Let’s go back to our previous example of a Company which is launching a new line of sports shoe for runners. The population for the research is all individuals who wear shoes while the target population would be runners or joggers. In practicality we need to find our target population but the way we approach is we see who we have access to. We could get access to people who are runners through club membership, directory, or Facebook groups that is called a sampling frame. We draw a sample from using the access to people that we have. And finally, we have respondents who are those who actually responded the questions asked for the research. In the left hand we have the complete sampling steps starting from population to respondents.
The Bigger Picture
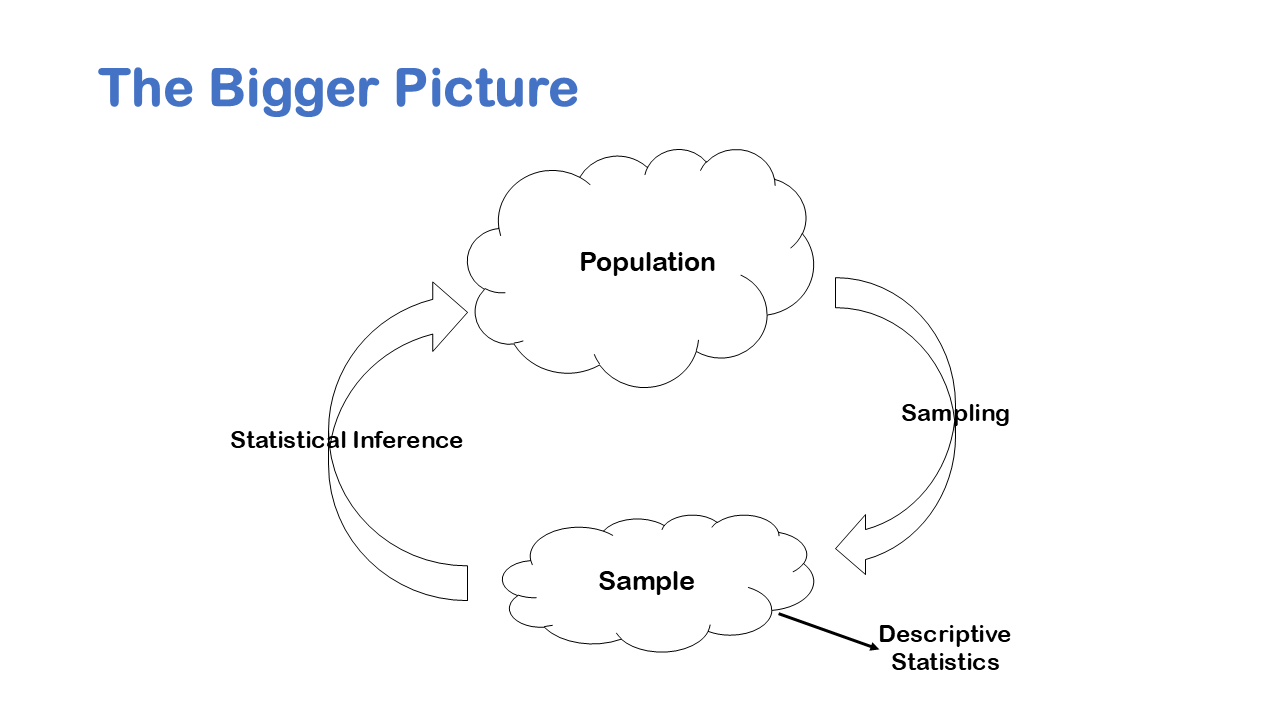
A lot of Statistics is really about going from a sample to a population the idea is to make a sample generalizable to the population. Please keep in mind that the answer or conclusion to the research problem does not make sense if it is applicable for sample, which could be generally 300 or 500. The result finding should be applicable to a wider audience that is population.
Samples are taken so frequently we like to distinguish between descriptive and inferential statistics descriptive statistics is about organizing and presenting data from a sample or population. So, you have a sample of data or you have a population of data when you’ve collected a census. In descriptive statistics you just describe the data at hand. Inferential statistics it’s about making conclusions about a population based only on data from a sample. So, in descriptive statistics you might say I’m just describing a sample of data; inferential statistics is saying something about a population based on a sample of data.
Descriptive Statistics
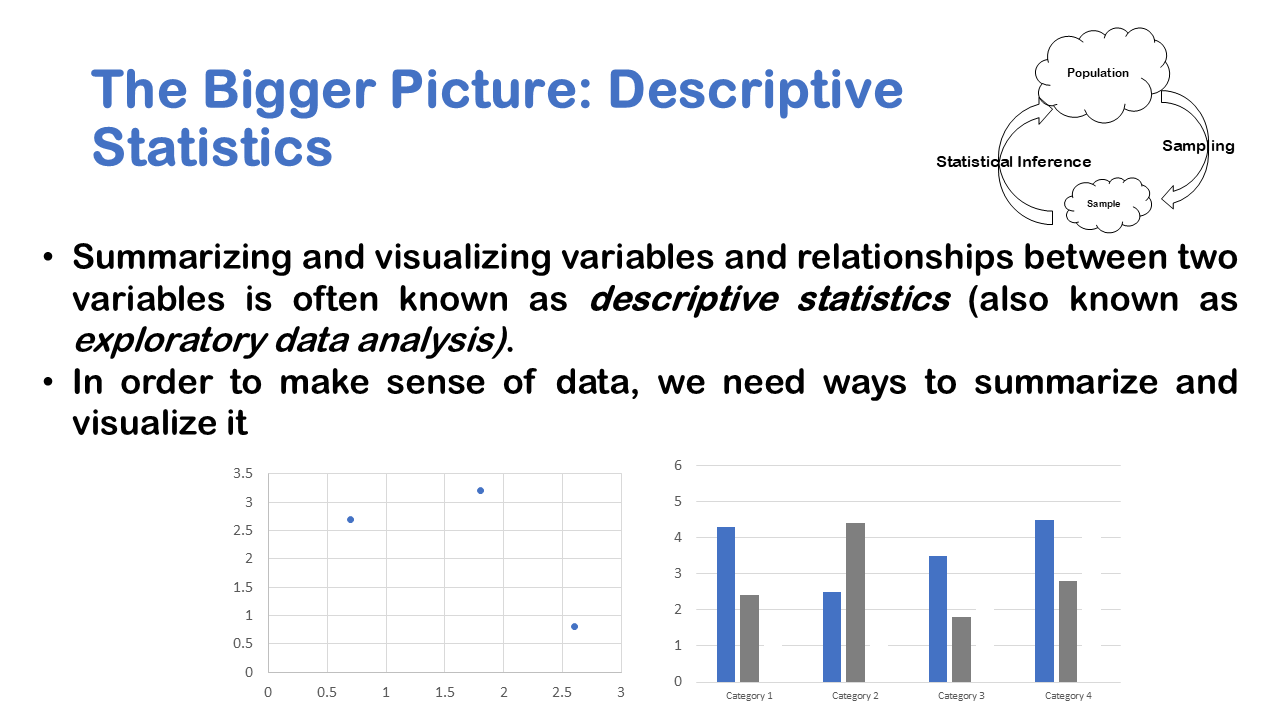
Let’s talk a little bit about descriptive statistics. A lot of descriptive statistics it’s about presenting data so you might present data in the form of tables or some visual tools such as bar graphs and so on. Another aspect of descriptive statistics is about summarizing data so you might look at the average height of respondents in a sample and have a numerical summary of a sample of data. You might also look at the percentage of men in a country based on some Census data in descriptive statistics. The key point is that you’re using numerical summaries to say something about the data at hand either a sample or population
Inferential Statistics
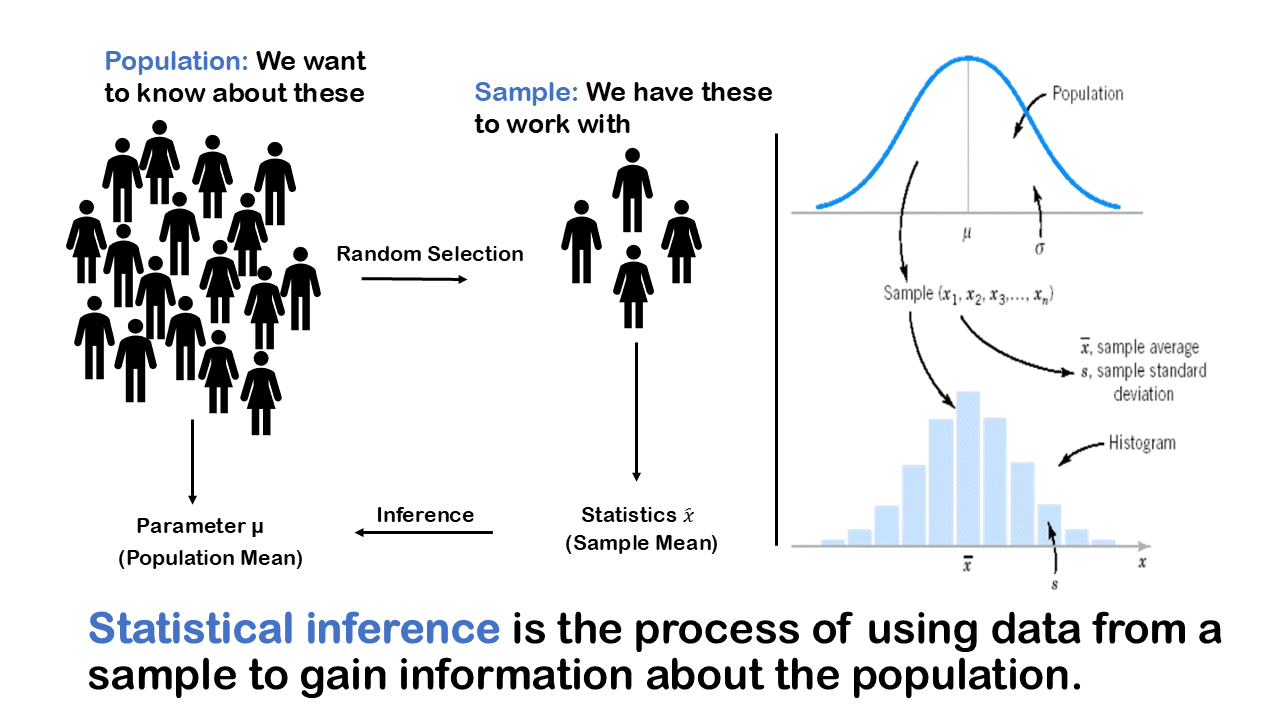
Inferential statistics involves estimating. So, for example you might use the average height from a sample to estimate the average height in a population. Inferential statistic often also involves hypothesis testing, so you might use a sample of data to test some claim. For example, you might consider the average height in a population is 72 inches, so you collect a sample and you test that hypothesis and you test that claim using that sample of data. We define Statistical inference as the process of using data from a sample to gain information about the population.
Sample Statistics and Population Parameters: Notation for sample and Population
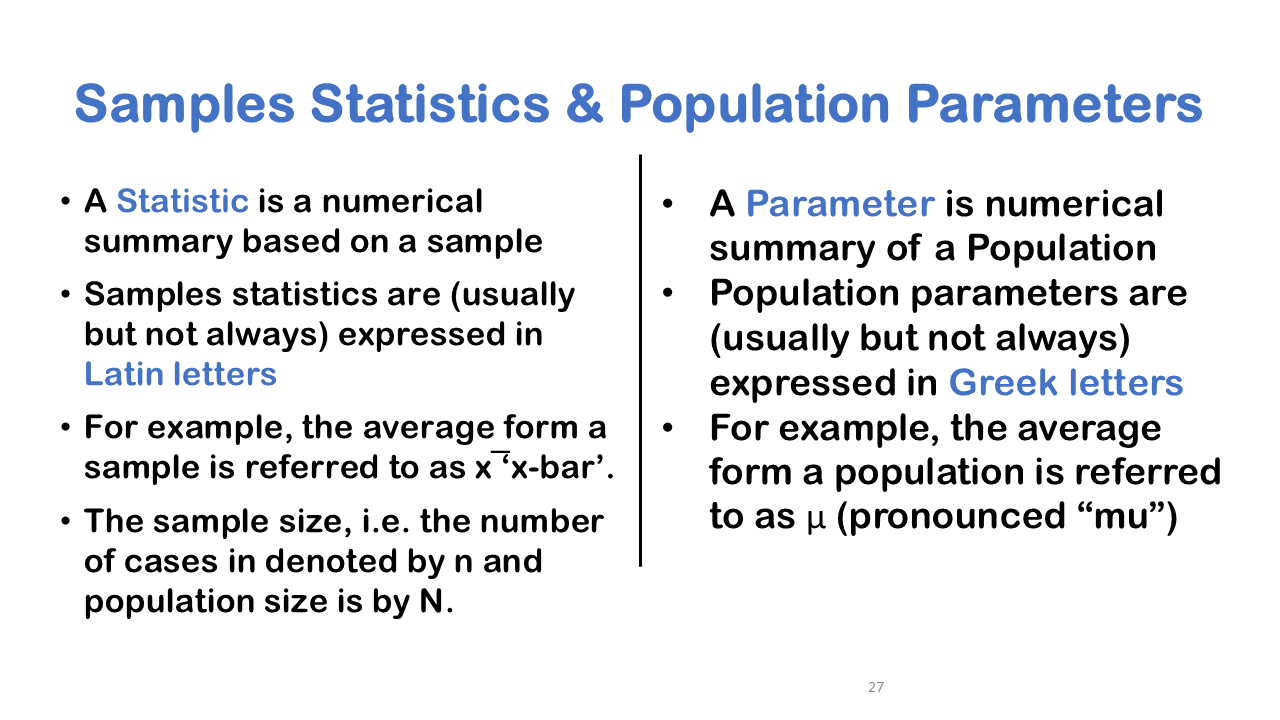
when we talk about samples and populations, we like to distinguish between sample statistics and population parameters. A sample statistic or statistic for short is a numerical summary based on a sample for example you might say what’s the average weight in a sampled hospital patients in London that is a statistic. A parameter is a numerical summary of a population sometimes we call these population parameters, so for example the average weight of all hospital patients in London that is a parameter or population parameter.
It’s also useful to distinguish between sample size and population size, the idea is that you want to keep track of whether you have a sample of data or population. If your data set is a sample of a population the number of cases the total number of rows in your data will be labelled with a lowercase n, if your data set consists of the entire population in the number of cases is labelled capital N and this is just so we can remind ourselves whether we’re dealing with a population or a sample.
The sample statistics are numerical summaries from a sample of data are usually but not always expressed in Latin letters. For example, if you look at the average from a sample this is labelled X bar it’s pronounced X bar and this is by convention. Population parameters are generally expressed in Greek letters, so for example the average from a population is referred to by the Greek letter mu. So, you can see that we like to in general to distinguish between population parameters expressed in Greek letters and sample statistics expressed in Latin letters.


