Previous article discussed the basic contingency table of proportions and percentages. People often want to ask more about relationships between these two categorical variables more explicitly. To put another way, we want to know the percentages, conditioning on particular values. so far, we know the overall percentages and we know the percentages for particular combinations but we want to condition on some set of values to and calculate the percentages. Contingency table is called contingency table because often you want to condition or you want to say things that are contingent upon the values of another variable.
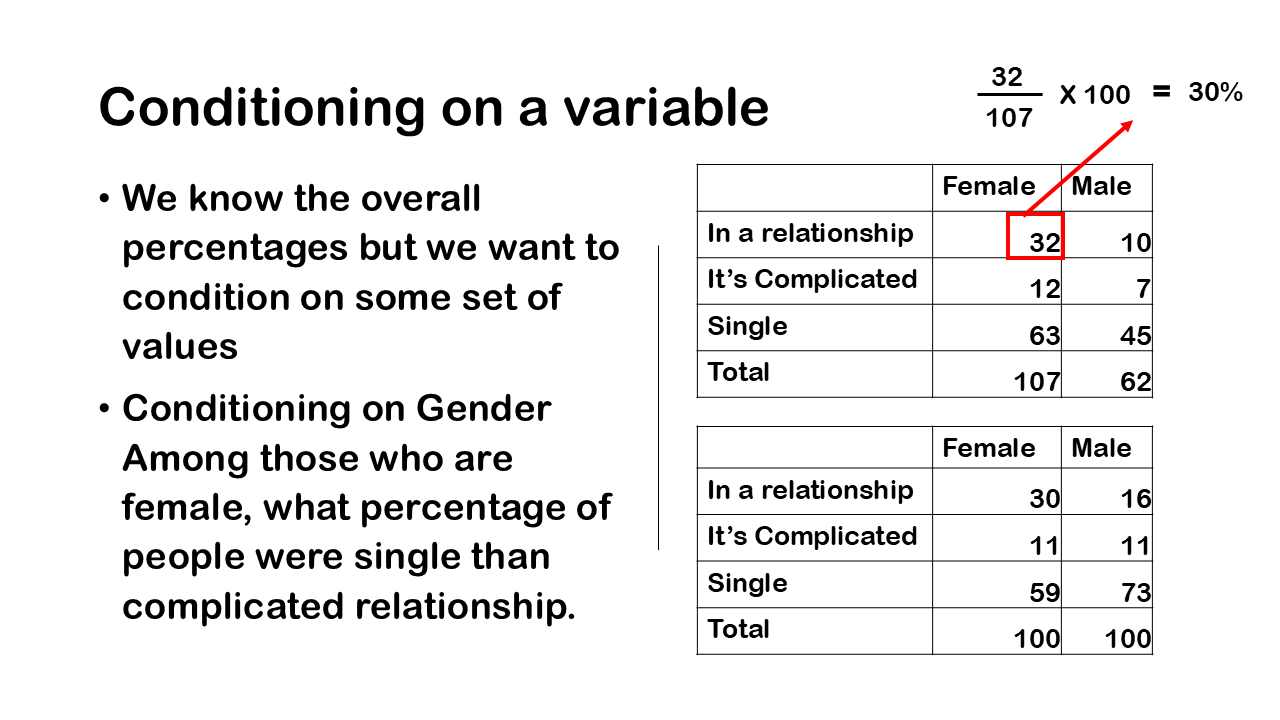
For example, someone might pose a question that, among those who are female, what percentage of people were single than complicated relationship. This is conditioning on gender. In a similar way but in a different way we might condition on relationship status, so you might say among those who were in relationship, what percentage is male?
So, let’s look at a contingency table in which we’re conditioning on Gender, what we do is we divide the cell counts by the corresponding total for each category of the gender, i.e. male and female and then we multiply by 100, this will give us the percentages. so, you can see that we have the total for female category i.e., 107 people who are female and 62 people are male and when we divide each cell by its respective column total, we get these percentages.
We divide for those who are in the relationship is 32, the total overall of those who are female is 107. In a similar way we know that 11 percent were in a complicated relationship both male and female. We’re just taking the cell counts for that for a particular cell and we’re dividing by the total number of counts of people who are female.
To answer the question that we pose earlier, among those who are female, what percentage of people were single and what percentages are in complicated relationship, 59 % are single and 11% are in complicated relationship as it is clearly visible from the above figure.
Two categorical Variables – Conditioning on relationship status
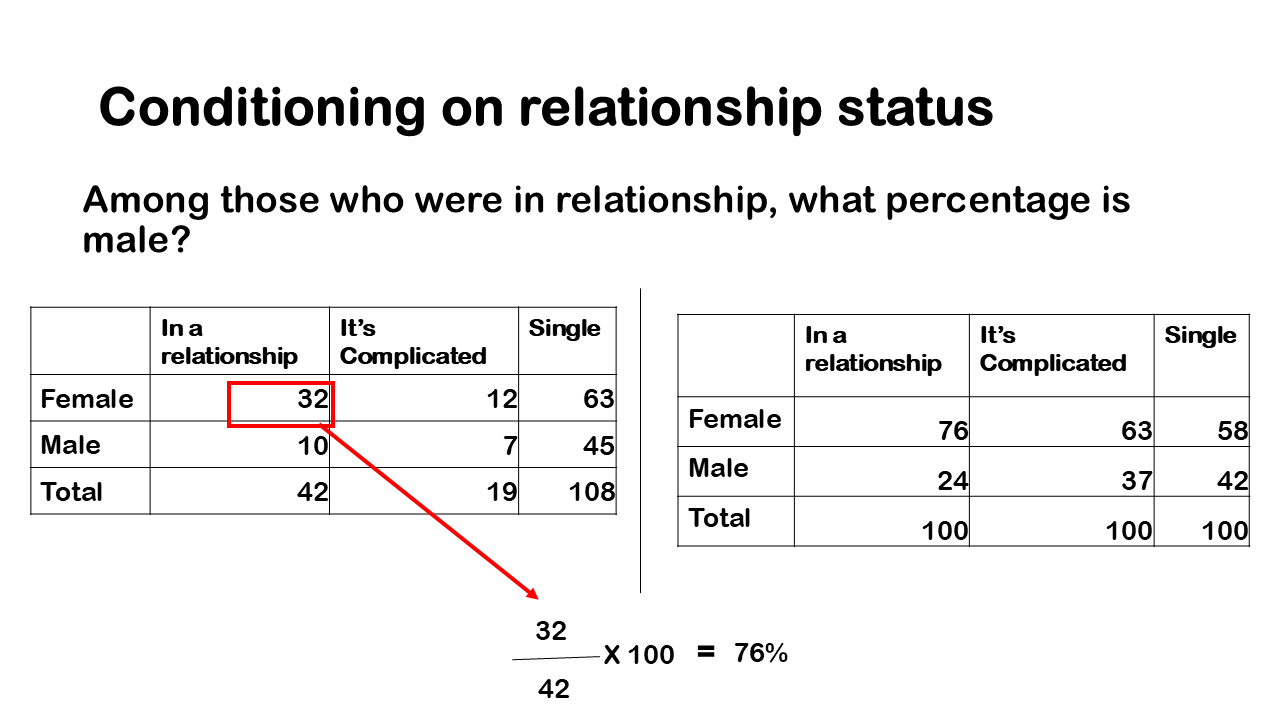
We can take a different approach and condition on relationship status; what we’ll do is we’ll divide the cell counts by the corresponding total for each level of class and then multiply by 100.
Let’s go through a few examples what we’ll do is we’ll take the cell count for this particular combination which is 32 and divided by 42 and that is just the total number of observations overall, of those people who are in relationship. This will tell us among those who were in a relationship and are female, when we are conditioning on class.
To answer the question, among those who were in relationship, what percentage is male? We can see that only 24% are male. While the previous table has just 16 % are male and are in the relationship. The difference is because it all depend on the conditioning whether it is relationship status or gender.
Conditioning on relationship status – Percentages
If you are in a relationship, it is 76% chance that you are female, also if you are female, then you have 30% chance of being in relationship which is higher than male as we have seen previously when conditioning on gender. The results differ as whether we are conditioning on relationship status and gender but gives the same conclusion. This led us to conclude that females are likely to be in are relationship or have greater chance of finding the life partner than male counterpart. There is a relationship between gender and their relationship status. Both the variables are not independent.
Difference in proportion
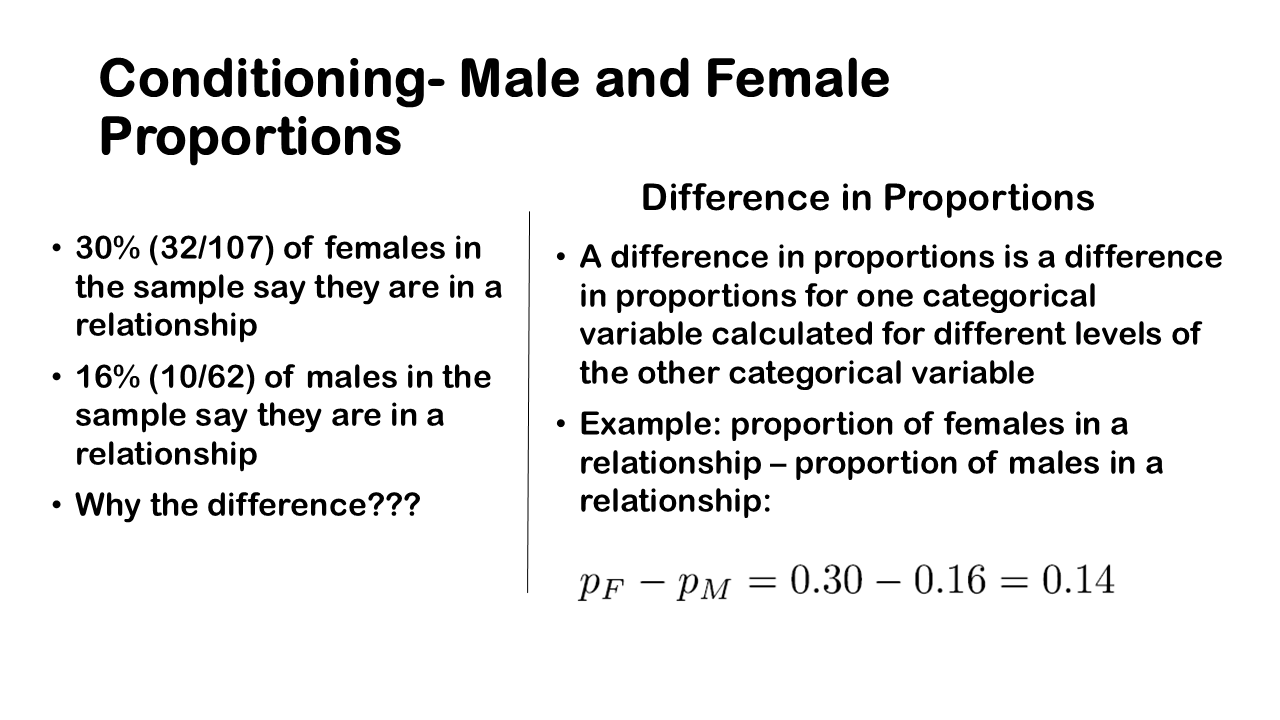
We can also calculate the difference in proportion, if you look at the previous table, 30% of females in the sample say they are in a relationship while only 16% of males in the sample say they are in a relationship. There is a difference. The difference in proportions is a difference in proportions for one categorical variable calculated for different levels of the other categorical variable
Example: proportion of females in a relationship – proportion of males in a relationship: 0.14
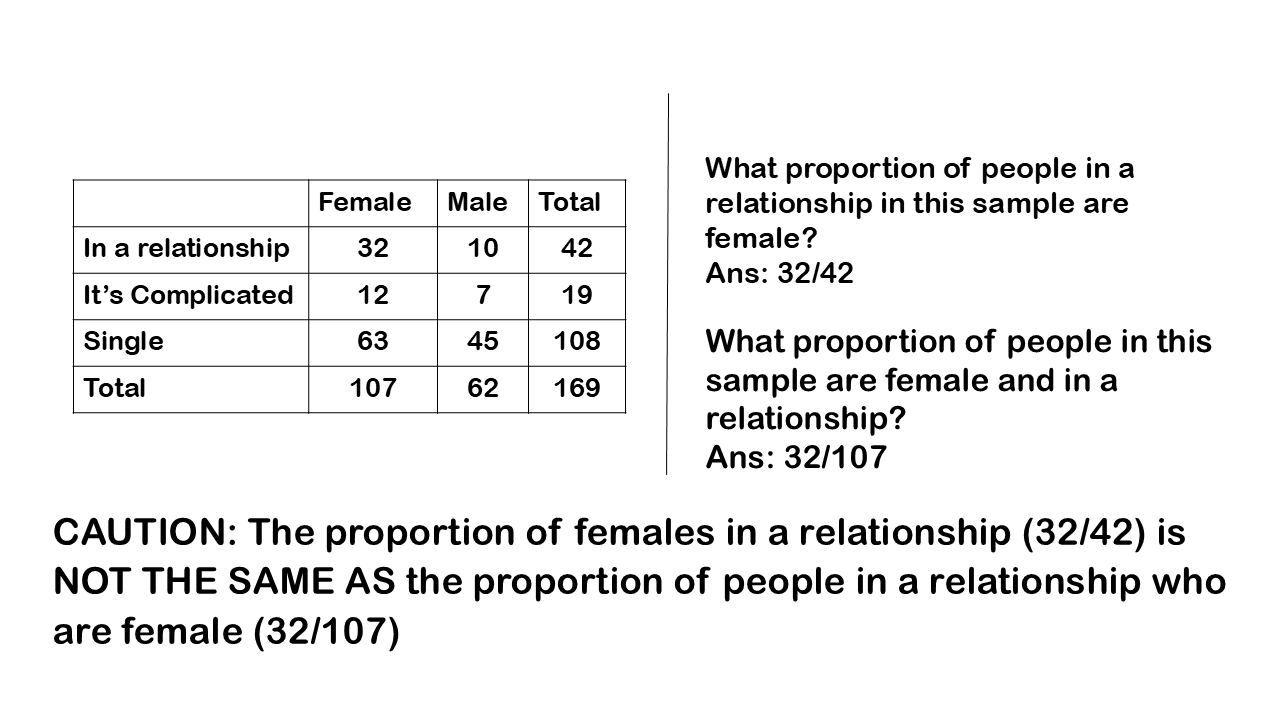
Again, to reiterate it, there is a difference when we ask, what proportion of people in this sample are female and in a relationship? And when we ask What proportion of people in a relationship in this sample are female?
Ans: 32/107
What proportion of people in a relationship in this sample are female?
Ans: 32/42
We can have a word of caution here as the proportion of females in a relationship is NOT THE SAME AS the proportion of people in a relationship who are female!
Distribution
Now it’s a good time to discuss, what a distribution is? A distribution is simply the arrangement of values of a variable showing their relative frequency meaning the proportions or percentages. We think of the distribution all the time, imagine have a group of 10 friends and you ask about their favourite ice cream flavor. The possible flavors are Vanilla, Chocolate, and Strawberry. A bar chart or frequency table can visually represent this distribution, where each bar represents the number of friends who prefer each flavor.
You can talk about a distribution that is unconditional or marginal, joint or conditional. so, when we look at these contingency tables it’s useful to talk about it in a way that it references the idea of these type of distribution.
Unconditional (marginal), joint and conditional distribution
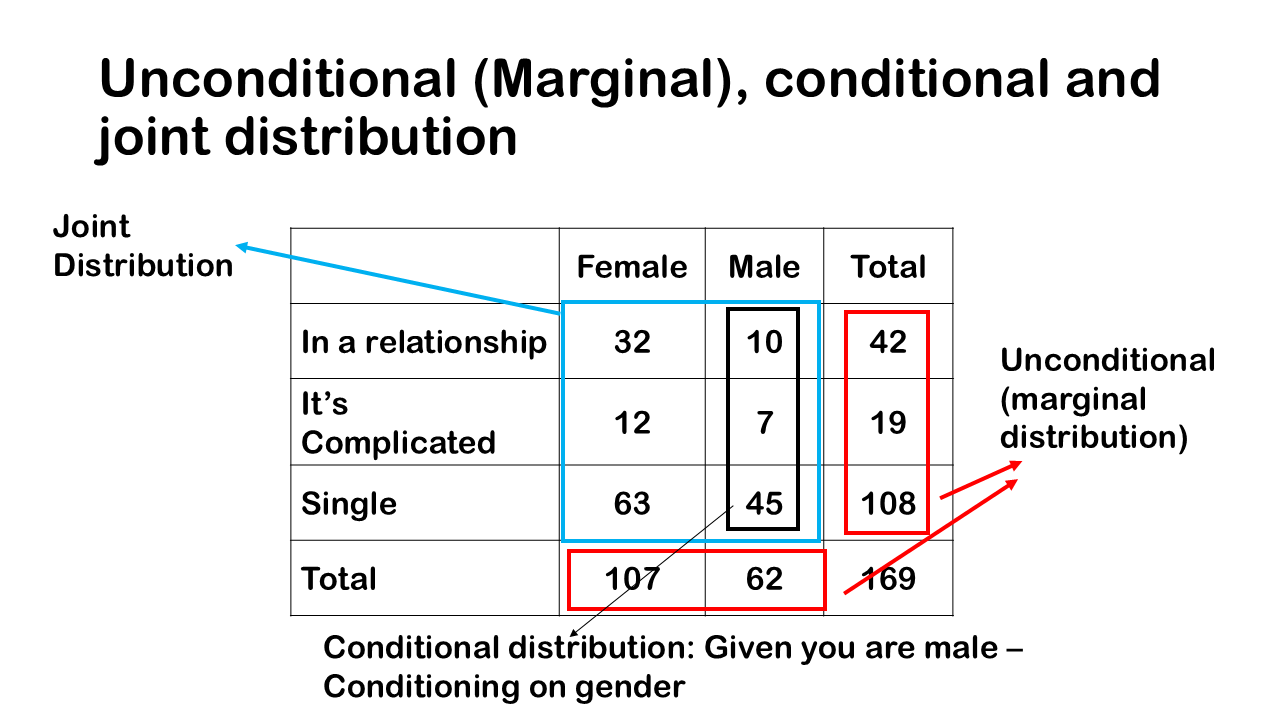
Above figure depicts an unconditional distribution or marginal distribution of that we’ve highlighted. Pls keep in mind that they are in the margin and hence called marginal distribution.
The Joint distribution is at the left side of the plot and is given by particular cells jointly.
At the bottom, we have conditional distributions are given here the distribution of relationship status, conditional on whether you are male or female. The highlighted box in red is conditioned on male. In the similar way we can also condition on the relationship status shown in the extreme right of the table in red box.
The whole point about these distributions is that it can be used to examine the relationship between two categorical variables, when there’s a relationship between two variables, we say that the two variables are not independent.


