To better illustrate the concepts of mean, median and mode, let’s dive into an example survey about what makes a great career in data science, according to undergraduate students. Imagine we surveyed college students, asking them to rank four key parameters they believe are essential for aspiring data scientists. The options they had to rank were: good grades, networking, communication skills, and projects & assignments. By analyzing their responses, we can uncover valuable insights into their perceptions and priorities. Let’s see how mean can help us make sense of this data!

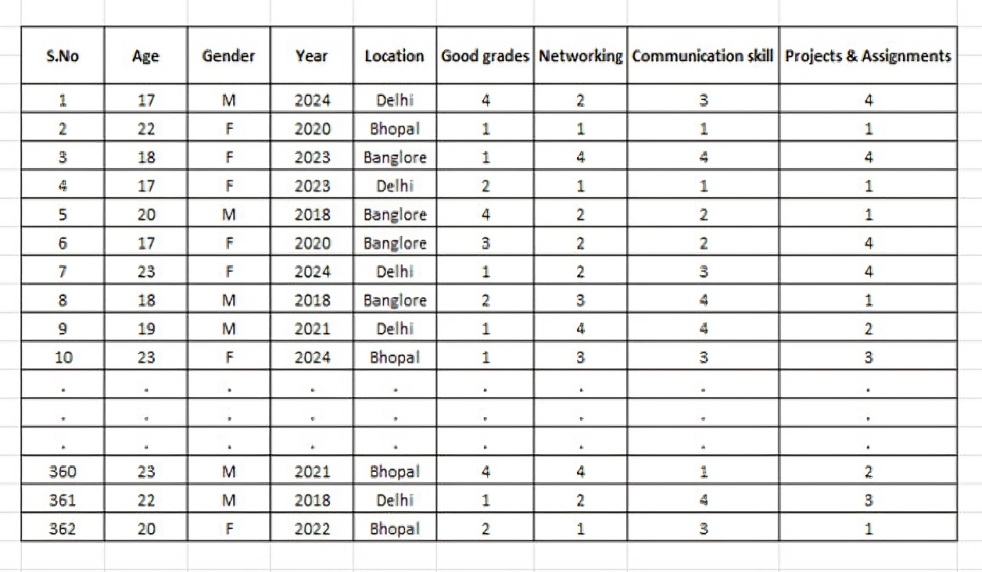
Take a look at this intriguing dataset featuring responses from 362 students—our entire sample size. With 362 rows, each representing an individual student’s input, we dive into various insightful details. The columns reveal a wealth of information, including:
• Age: How old are these future data scientists?
• Gender: Who’s making strides in this field?
• Year of Study: Where are they in their academic journey?
• Location: Where are these students based?
But that’s not all! We’ve also asked these students to rank four key parameters that they believe are crucial for a successful career in data science.
Column Breakdown
But before that let’s categories our variables. Pls, recall we have discussed two kinds of variables in our first class numerical and categorical.
Age: This is a numerical discrete variable. Think of it as the non-negative counting numbers we’ve discussed in class.
Gender: Here, we have a nominal categorical variable. It captures whether a student identifies as male or female, but there’s no ranking involved—it’s purely descriptive.
Year of Study: This one’s an ordinal categorical variable. It tells us which year the students are in—1st, 2nd, 3rd, or 4th. There’s a clear order, reflecting their academic progression.
Location: Despite our earlier discussions, let’s clarify—location is a nominal categorical variable. It indicates whether a school is in a rural, urban, or suburban area, but there’s no inherent ranking among these.
The Final Four Columns: These are where things get really interesting. Each student has ranked four key parameters essential for a successful career in data science. These parameters are:
• Good Grades
• Networking
• Communication Skills
• Projects & Assignments
Each student assigns a rank to these parameters, from 1 to 4. So, the final four columns are numerical discrete variables, capturing the students’ priorities in building a stellar data science career.
Mean of survey variables: Key to great career in data science

In this data set many of our variables are numerical not categorical? While we do have a few categorical variables like gender, year of study, and location, the majority of our columns—like age and the ranking variables—are numerical. Numerical data can take on many different values, making it a bit more complex to describe and understand compared to categorical data.
A natural question arises: What is the average ranking for each of these variables? Essentially, we want to understand, on average, how students prioritize these aspects. Are grades considered most important, or do networking, communication skills, or project experience take precedence?
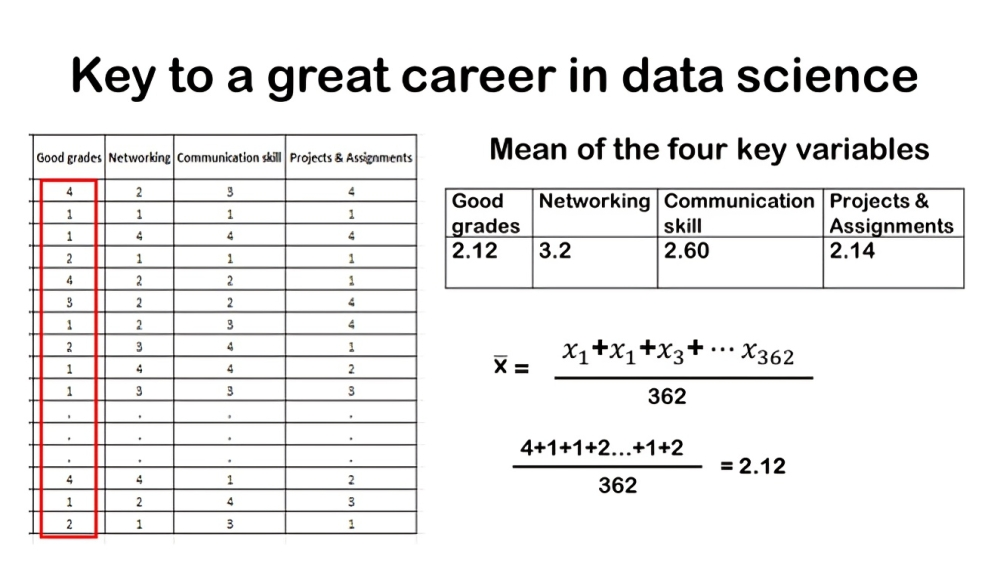
To answer this, we can calculate the mean ranking for each variable. By computing the mean, we obtain a clear numerical summary that reflects the average perception of students regarding the importance of each factor.
Result of survey
Let’s delve into the results from our dataset regarding what students consider important for a successful career in data science. We’ve analyzed four key variables: grades, networking, communication skills, and projects, each representing how students rank these factors from most to least important.
Starting with the grade variable, we used statistical software to calculate its mean ranking, which turned out to be 2.12. This means that, on average, students rank grades among the top two factors they deem crucial for success in data science. Remember, a lower numerical ranking signifies higher perceived importance — with 1 indicating the most important and 4 the least.

Next, let’s consider networking. The average ranking for networking was found to be 3.2. This suggests that, on average, students view networking as moderately important compared to other factors in the realm of data science careers. Moving on to communication skills, the mean ranking obtained was 2.60. This places communication skills slightly higher than the midpoint of importance among the factors examined.
Lastly, for projects, the average ranking was calculated to be 2.14. This indicates that students generally prioritize hands-on project experience as one of the more important factors for achieving success in data science careers.
These mean rankings provide valuable insights into student perspectives and priorities within the field. They highlight the varying degrees of importance placed on grades, networking, communication skills, and projects. Such insights are crucial for educators, career advisors, and industry professionals seeking to understand and cater to the needs of aspiring data scientists.
To clarify, if we use the mean as a measure of central tendency, grades emerge as the highest-ranking factor in terms of perceived importance for a successful career in data science.


