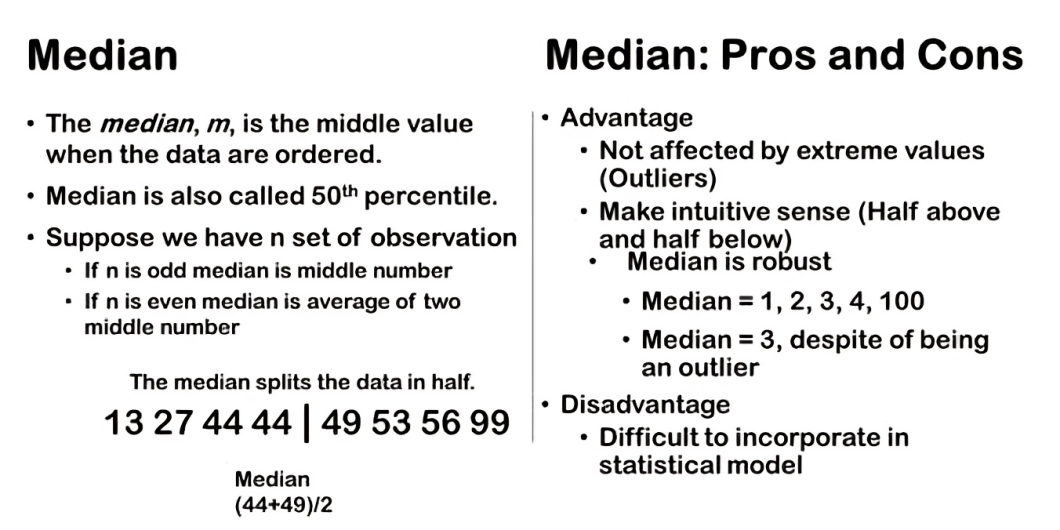
We’ve discussed the mean previously about mean or average as a measure of central tendency, let’s explore two other important measures: the median. This measures provide different perspectives on what constitutes a typical observation within a dataset. The median is often referred to as the 50th percentile. It represents the middle number in a dataset when the observations are arranged in ascending or descending order. This middle point divides the dataset into two equal halves, with half of the observations lying below and half above the median. Calculating the median depends on whether the dataset contains an odd or even number of observations:
• If there is an odd number of observations, the median is simply the middle number.
• If there is an even number of observations, the median is the average of the two middle numbers.
For instance, if we have 7 observations, the median would be the 4th observation when arranged in order. If we have 8 observations, the median would be the average of the 4th and 5th observations. The median provides a robust measure of central tendency, particularly useful when dealing with skewed distributions or datasets containing outliers. Unlike the mean, which can be influenced by extreme values, the median remains relatively unaffected by outliers, making it a valuable tool for understanding the typical value or position within a dataset.
Let’s explore the concept of the median further with a practical example. Suppose we have a set of observations: 13, 27, 44, 44, 49, 53, 56, 99, and 100. To find the median, we first arrange these numbers in ascending order: 13, 27, 44, 44, 49, 53, 56, 99, 100. Since we have an odd number of observations (9 in total), the median is simply the middle number, which is 49. This means that half of the observations are below 49 (13, 27, 44, 44) and half are above it (53, 56, 99, 100).
Now, let’s consider an example with an even number of observations: 13, 27, 44, 44, 49, 53, 56, 99. Again, we arrange these numbers in ascending order: 13, 27, 44, 44, 49, 53, 56, 99.
Here, with 8 observations, the two middle numbers are 44 and 49. To find the median, we take the average of these two middle numbers: Median= (44+49)/2 = 46.5. In both cases, whether odd or even, calculating the median involves ordering the observations and identifying the middle value(s). This approach ensures a clear and consistent method for determining the median in any dataset.
When dealing with large datasets, especially those with thousands or millions of observations, statistical software is typically used to compute the median efficiently. Modern tools make it straightforward to find the median or 50th percentile, providing a robust measure of central tendency.

Advantage and Disadvantage
One of the key advantages of using the median as a measure of central tendency is its robustness against extreme values or outliers. Unlike the mean, which can be heavily influenced by outliers, the median remains relatively unaffected. This makes the median a more reliable measure when dealing with datasets that contain extreme values. Another intuitive advantage of the median is its simplicity and interpretability. The median represents the middle value in a dataset, dividing it into two equal parts where half of the observations are lower and half are higher. This straightforward interpretation makes it easy to grasp the central tendency of the data at a glance.
However, the median does have its drawbacks. One significant disadvantage is its limited utility in more complex statistical models. Unlike the mean, which is commonly used in various statistical analyses and models, the median can be more challenging to incorporate due to its simpler calculation and less nuanced representation of the data distribution.
Let’s explore the concept of the median and its resilience against outliers using a example. Suppose we have a dataset with observations: 1, 2, 3, 4, and 5. When calculating the median, we arrange these numbers in ascending order and find the middle value. Since we have an odd number of observations (5 in total), the median is simply the middle number, which in this case is 3. This means there are two observations below 3 and two above 3.
Now, consider if we introduce an outlier into our dataset. Instead of 5, let’s change one observation to 100. So, our dataset now looks like: 1, 2, 3, 4, 100. Despite the presence of the outlier (100), the number of observations remains the same and four out of five values are identical. However, when calculating the median again, it remains unaffected by the outlier. The median still stays at 3.
This example highlights a key strength of the median: its robustness against extreme values or outliers. Unlike the mean, which incorporates information from all data points and can be heavily influenced by outliers, the median focuses solely on the middle value(s) of the dataset. It doesn’t change even if an extreme value is added or modified, as long as the number of observations remains odd.
This robustness makes the median a preferred measure of central tendency in datasets where outliers are present or when the distribution is skewed. It provides a stable and reliable indication of the central value without being skewed by extreme values.
Median explained through survey example
Let’s revisit our survey dataset (link to article 12) where we explored four ranking variables related to perceptions of a successful career in data science. Using statistical software, we’ve calculated the median for each variable without the need for manual ordering or calculations.
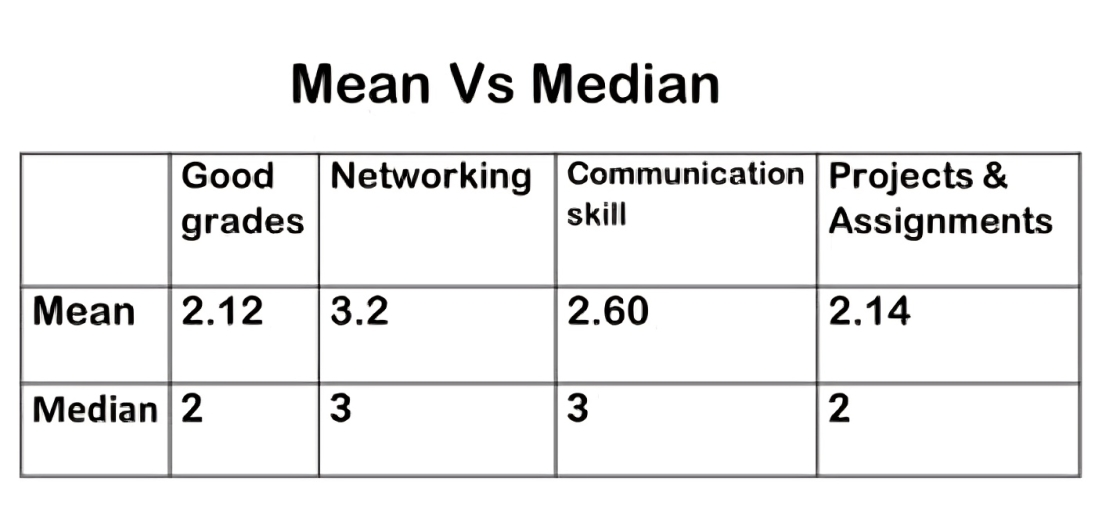
Firstly, for the grade’s variable, the median is 2. This means that, in terms of importance, grades are perceived as a central factor among college students, ranking higher relative to other variables.
Next, for networking, the median is 3. This suggests that networking is positioned as a middle-ranking factor in terms of importance for a successful career in data science. While still significant, it may not be as pivotal as other attributes according to the surveyed students.
Interestingly, the variables with the lowest median rankings are grades and projects, both having a median rank of 2. This highlights grades and practical project experience as the most crucial attributes perceived by students for achieving success in data science careers.
These median values provide a snapshot of how students prioritize different aspects when considering their career paths. They offer insights into which factors are perceived as most essential and which ones hold lesser importance.
Mean Vs Median

In earlier article we have calculated mean taking the survey example. Let’s compare the mean and median values for our survey variables related to perceptions of a successful career in data science. Both mean and median serve as measures of central tendency, offering insights into which attributes students deem important.
Starting with grades, both the mean and median indicate that good grades are perceived as the most crucial factor for a successful career in data science. This consistency suggests a strong consensus among students regarding the significance of academic performance.
When we look at the other variables, networking emerges as the least important according to both measures. Communication skills ranked slightly higher but still less essential compared to grades and projects.
Speaking of projects, it’s notable that the median ranks projects as equally important as grades. This implies that, on average, students view hands-on project experience as equally significant as academic achievement when considering career success in data science.
It’s important to note that while the mean and median provide similar findings, they do show slight differences in how they rank the importance of grades versus projects. The mean may show a slight distinction between these two variables, whereas the median treats them equally due to its nature as the middle value in an ordered dataset.
Overall, whether we analyze using mean or median, the key takeaway remains consistent: good grades are paramount for a successful career in data science, followed closely by practical project experience. This alignment in findings scores the critical role of academic achievement and hands-on learning in shaping career aspirations in the field.


