The Challenger disaster occurred on January 28, 1986, during the launch of the Space Shuttle Challenger. The Space Shuttle Challenger was a reusable spacecraft, and prior to the disaster, it had completed nine successful missions. However, on that fateful day, various factors came into play that would lead to a catastrophic event.
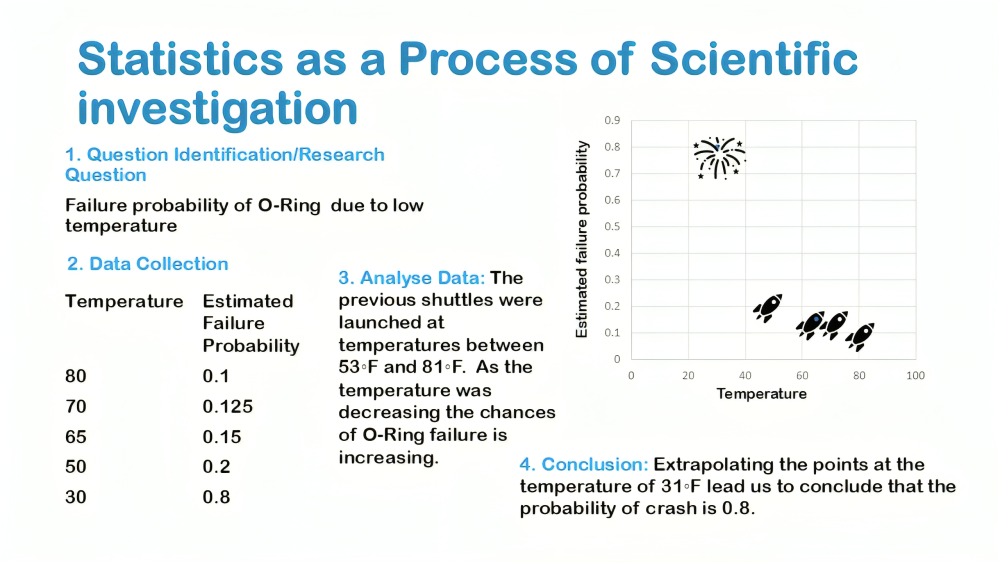
On the day of the launch, unusually cold temperatures were recorded at Kennedy Space Center. The shuttle’s boosters were not designed to operate in low temperatures. During the day of the launch the outside temperature was unusually low (31◦F). The previous shuttles were launched at temperatures between 53◦F and 81◦F. The Challenger’s solid rocket boosters were equipped with O-rings, which were intended to seal joints in the rocket’s segments. However, these O-rings became brittle in the cold weather, increasing the risk of failure.

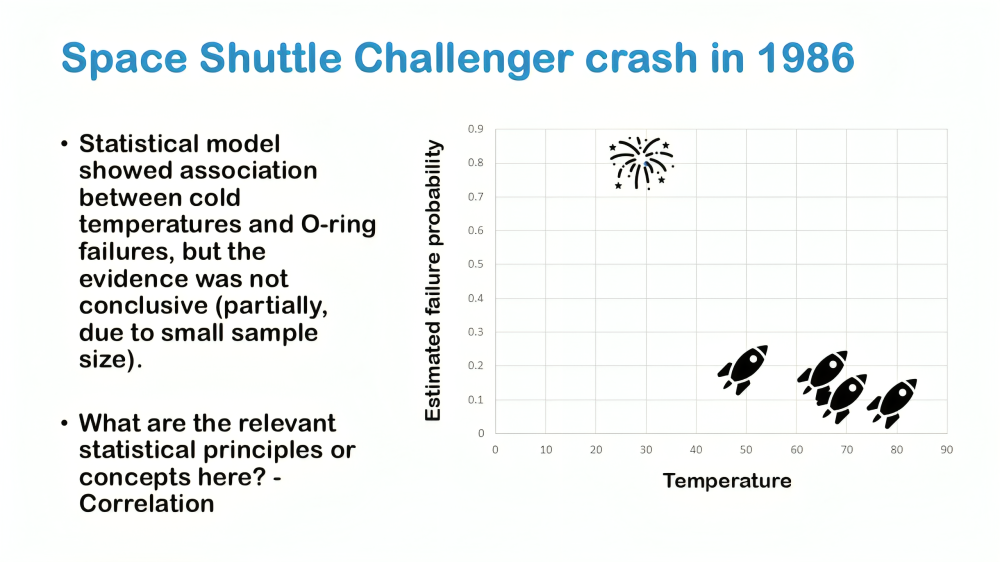
Statistical Engineers, expressed concerns about launching in such cold conditions. They presented data showing the correlation between low temperatures and O-ring failure. Statistical model had showed association between cold temperatures and O-ring failures, but the evidence was not conclusive. The scientist ignored the statistical finding.
Despite these concerns, NASA managers faced significant pressure to proceed with the launch. The decision to launch was made, emphasizing incomplete and inconclusive data. Just 73 seconds into the flight, the shuttle broke apart, leading to the deaths of all seven crew members. This chart illustrates the correlation between low temperatures and O-ring issues. The data clearly indicates a relationship, but correlation does not imply causation.
Statistics as a process of scientific investigation

We can think statistics as the process of scientific investigation. The first step is to identify a question or problem. If we take the example of space shuttle the question that we pose is successful launch of space shuttle in details the correlation between O ring failure and temperature. Question identification is the first step in of scientific investigation refers to the basic problem that researcher is trying to solve.
The second step is to data collect which refers to the various ways through which researcher collect relevant data related to the question. The data collected is launch of space shuttle at different temperature. In case of space shuttle data had small sample size and there were no data points below a 53◦F temperature.
The third step is to analyze data. We plot using scatter plot that shows the datapoints on X axis we have temperature and on Y axis we have the probability of success where 0 indicates failure and 1 success. To analyze the data generally we use statistical software’s and run some test on the data at hand. In the fourth and last step, we draw inferences or conclusion from the data and try to make sense out of the test that we ran.
We see statistics as a general process of scientific investigation. It is the study of how to collect, analyze and draw conclusion from the data. The goal of statistics is to take the general process of scientific investigation and to improve it. Especially step 2,3, and 4, data collection, data analyzation and conclusion and to make it more reliable, reproducible and rigorous. The space shuttle example highlighted how crucial a statistical use can be. In day-to-day life we pose many questions in life, when used data to come to a conclusion, it can push odds in our favor and help in wise decision making.


