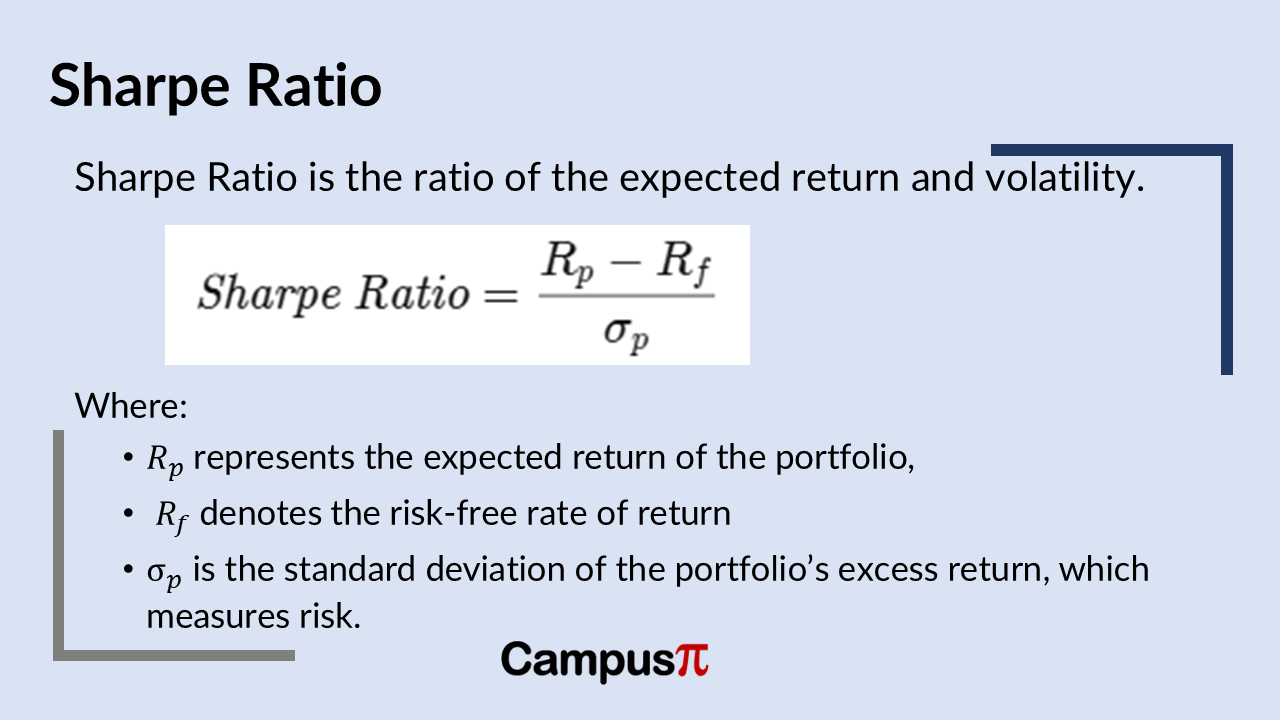
Sharpe Ratio is the most extensively used metric in the finance world to evaluate the performance of an investment. It measures the return of an investment relative to its risk, offering a clearer perspective on the efficiency of a portfolio. Sharpe Ratio is defined as the ratio of the expected return and volatility. By incorporating both return and volatility, the Sharpe Ratio helps investors make more informed decisions about their investments. By adjusting portfolios to maximize the Sharpe Ratio, investors can achieve a better balance between risk and return.
Key Summary
- Sharpe Ratio is the ratio of the expected return and volatility. By incorporating both return and volatility, the Sharpe Ratio helps investors make more informed decisions about their investments.
- A higher Sharpe Ratio suggests a better risk-adjusted return, while a lower value indicates that the investment may not be adequately compensating for the level of risk taken.
- When judging on a particular strategy, if the back testing results shows that the Sharpe Ratio is 2, it simply builds confidence that it’s a good strategy.
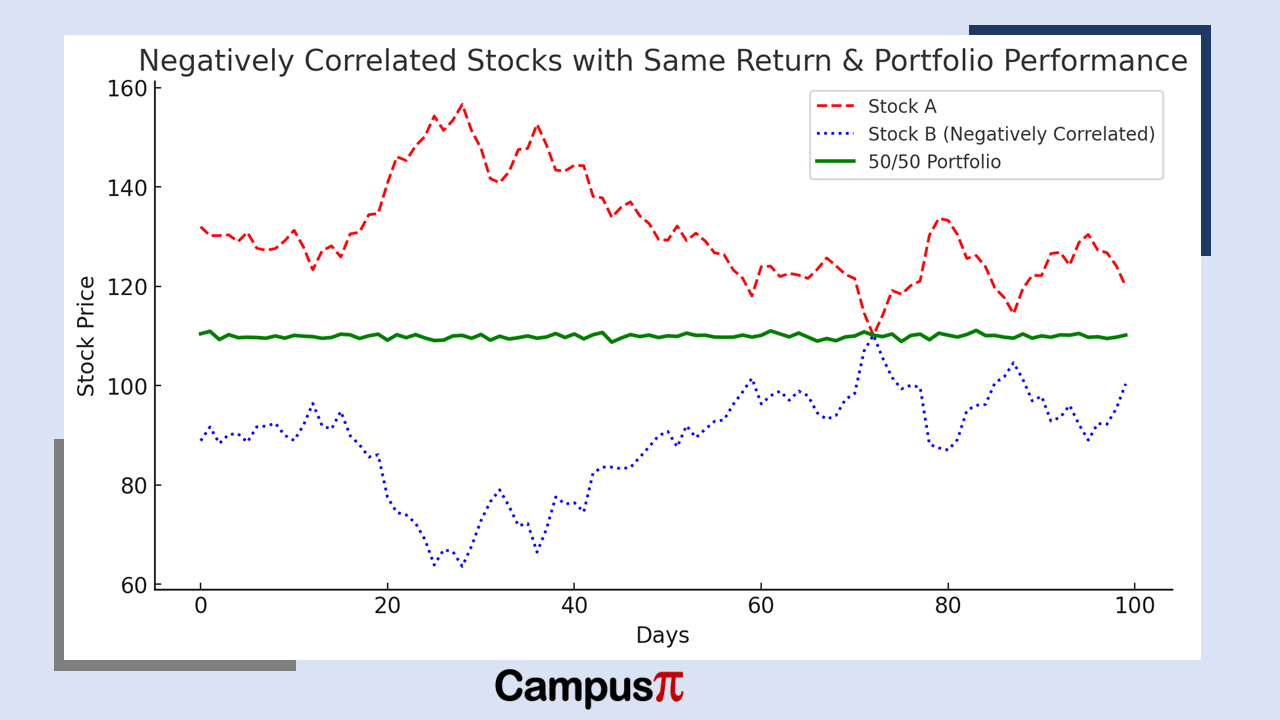
- In case of two negatively correlated stocks, we need to diversify the stock through creating a portfolio of two stocks, this will increase the Sharpe Ratio that both the stocks combined have.
- Sharpe Ratio treats all volatility as undesirable, failing to distinguish between upside and downside risk.
Majority of investors consider returns as one of the major parameters to judge the portfolio but investing is not only about return. The Sharpe Ratio essentially indicates how much excess return an investor earns per unit of risk. A higher Sharpe Ratio suggests a better risk-adjusted return, while a lower value indicates that the investment may not be adequately compensating for the level of risk taken.
Stocks with same return
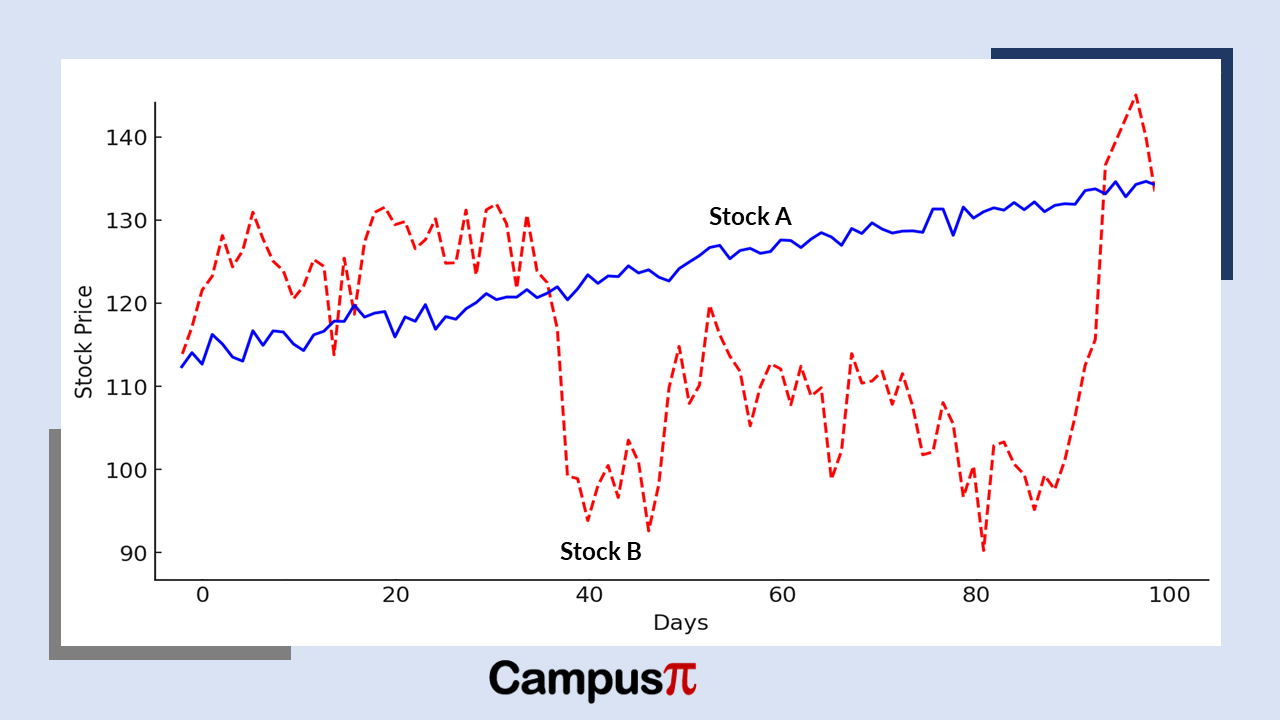
Let’s consider an example of two investment stock A and stock B, having the same return, the seldom question arises, which one is better? In order to answer which of the investment is better, we just can’t see returns as both the stock have the same return.

We can look in the given figure, the path of both the stocks taken to reach the same return. We can see that stock A took linear path; however, the stock B had a more volatile path.
In seems intuitive that stock A seems better, also stock B is painful to hold when it goes in downtrend and cheerful when in uptrend. On the other side, the stock A is following a steady path. There is high uncertainty in the stock B to recover the investment, when its goes down to negative.
One of the other reason stock B is bad is also due to liquidity. It may happen that at some point of time we need our money; what happens when we need it and the stock is down to 10%. We may have to sell at loss while on the other hand stock A is growing steadily at every point, the slope is consistent. We can interpret with the above logic that stock A is better investment than stock B, while both of them have the same returns.
To quantify our intuitive understanding, we use Sharpe Ratio to judge which stock perform better. The Sharpe Ratio is the risk adjusted measure performance. It is the ratio of the average daily return divided by the volatility. Volatility in the denominator punishes the returns. More the volatility is the lower the return will be.

The Sharpe Ratio of the both the stocks discussed as example is different which gives a healthy metric to judge an investment better. Stock A has a Sharpe Ratio 2 while the stock B have a Sharpe Ratio of 0.5 which validate our intuition that stock A is better. A higher Sharpe Ratio generally signifies that it had managed its risk and returns properly.
Interpreting the Sharpe Ratio
A Sharpe Ratio above 1 is generally considered good, as it implies that the investment provides sufficient returns for the risk involved. A ratio above 2 is viewed as very good, while a value exceeding 3 is deemed excellent. Conversely, a ratio below 1 suggests that the risk taken may not be justified by the returns, making the investment less attractive.
Negative correlation and diversification
Let’s consider another example with two stocks A and B having the same Sharpe Ratio. Which simply mean both have the same return and volatility. How do we identify the two stocks which one is better? As we can see in the graph, both the stocks are negatively corelated and a combination of both the stock A and B will give an optimum return. Both the stocks have a Sharpe Ratio of 2 while the combination of both have the Sharpe Ratio of 5. This is why we need to diversify the negatively correlated stocks.

Limitations and Alternatives
Sharpe Ratio assumes that returns are normally distributed, which may not always be the case in real-world financial markets. Additionally, it does not account for the potential impact of extreme market events, known as tail risks.
Sharpe Ratio treats all volatility as undesirable, failing to distinguish between upside and downside risk. Some investors prefer alternatives such as the Sortino Ratio, which focuses only on downside deviation, or the Treynor Ratio, which considers systematic risk instead of total risk.


