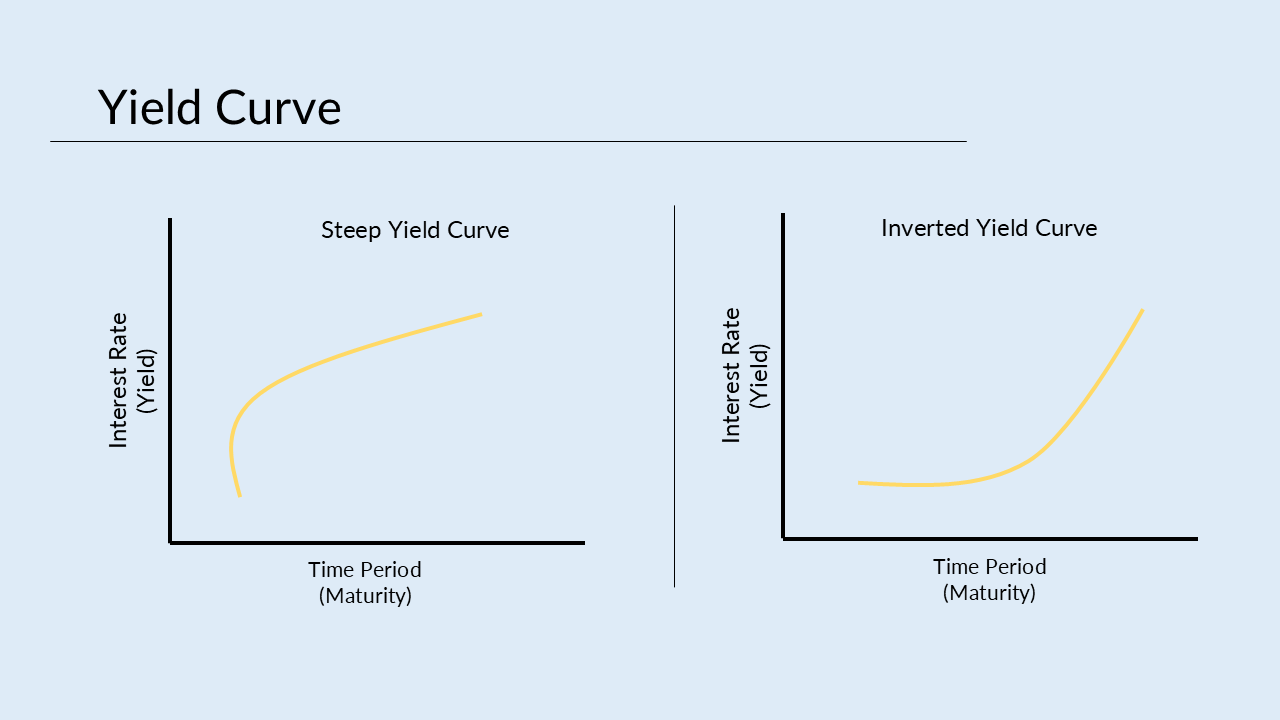
Stock Traders look for various signal like GDP, inflation rate, interest rate to predict the future economic condition. One of the indicators is from the bond market known as yield curve used by the investors. The yield curve predictive power of economic condition had made it a crucial metric for investors. It is a very accurate predictor or warning of upcoming market conditions like slowdown or recession.
Key Summary
- Yield curve is a graph showing the relation between short term and long-term interest rate of treasure note.
- The relationship between the short-term interest rate and long-term interest rate decides the market conditions. If long term interest rate is higher than short term then it signals economic expansion while opposite signals slowdown or recession.
- If both have the same interest rate then we have a flat curve, if the long term is lower than the short-term interest rate then we have an inverted yield curve.
- An inverted yield curve generally as signal for an upcoming recession.
Yield curve is a graph showing the relation between short term and long-term interest rate of treasure note. A treasury note is issued by the government which provide a fix interest rate over a period of time to the public. Usually, the short-term interest rate in lower than the long-term interest rate. A steep yield curve (when long-term rates rise significantly) suggests economic expansion and vice versa.
Long-term and Short-term interest rate

For longer term treasure note the interest is higher because, you are lending the cash for a longer period of time thereby more risk taken. A long-term interest rate is usually higher also because as the economy grows investors demand more money that they actually lend but long-term economy may not be giving higher interest rate which is where the problem come in. As a predictor of future economic condition, if long term interest rate is higher than short term then it signals wellness in market.
Sometimes, the relationship between the short-term interest rate and long-term interest rate changes. If both have the same interest rate then we have a flat curve, if the long term is lower than the short-term interest rate then we have an inverted yield curve. This is when the market is concerned about it. An inverted yield curve generally as signal for an upcoming recession.
Recession Time Frame
Recession does not happen immediately after the inversion, but it means that we are in near one year it could happen. The yield curve may take a year or two to kick in and show an upcoming recession. A quick curve inversion in a day, week or even in the month are not gives strong signal and nothing to worry but a continuous yield curve inversion for months does.
To get a prediction the upcoming market condition, we take the difference between a three month and 10-year interest rate of a treasury note, if the value that we get is zero and less than zero then this is when we say we have a problem. Less than zero generally represent an inverted yield curve. In the finance it is common to take a difference between a two year and 10 years difference in interest rate as a good predictor. Since 1950 every yield curve inversion has been successfully predicted as recession. It is one of the leading indicators of the economy.


