Imagine you’re a teacher assessing student performance in a math exam where scores range from 0 to 100. You’ve collected a dataset with each student’s name and their respective marks. Now, let’s delve into analyzing these scores using measures of central tendency.
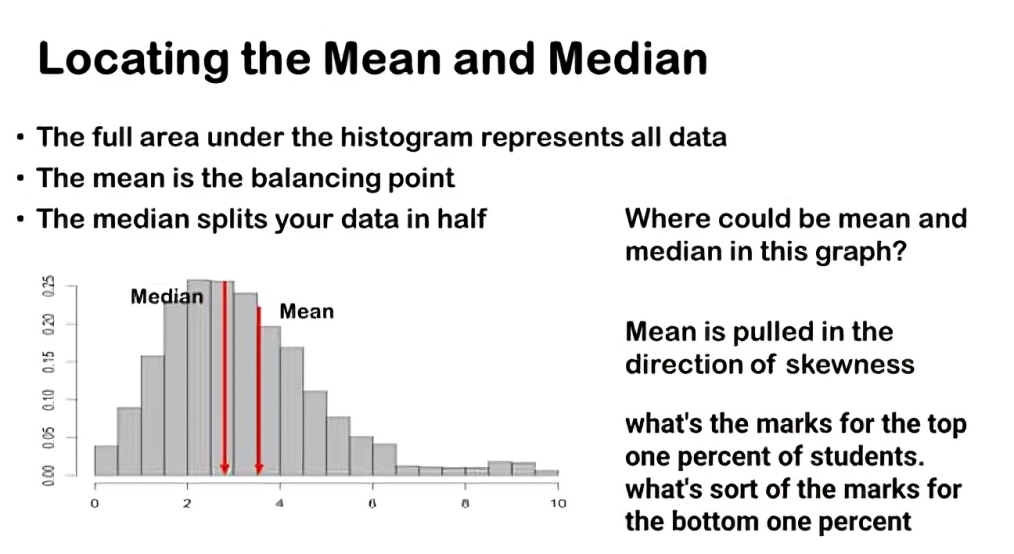
Using statistical software, we calculated the mean and median scores for the dataset. The mean score, averaging around 75, suggests the typical mark obtained across all students. However, it’s essential to note that the median score, approximately 68, is slightly lower than the mean.
This difference between the mean and median indicates that some students achieved markedly high scores, pulling the mean upward relative to the median.
In real-world contexts, such as reporting income statistics, the median is often favored over the mean. This preference arises because the mean can be skewed by extreme values—like the incomes of a small number of very wealthy individuals—resulting in a misleading representation of the typical income level. Instead, the median income provides a more accurate snapshot of the center of the income distribution, reflecting what most people typically earn.

Similarly, in our exam scores dataset, the median score gives us a clearer picture of the central tendency of student performance. It represents the score at which half of the students scored below and half scored above, without being heavily influenced by extreme scores at either end.
When deciding which measure of central tendency best captures the typical observation in a numerical dataset, we often consider the characteristics of the data and our analytical goals.
The mean is widely used and provides a straightforward average of all values. However, it can be heavily influenced by extreme values or outliers, making it less suitable for skewed datasets. In such cases, the median offers a robust alternative. It represents the middle value when all observations are ordered, making it less sensitive to extreme values and thus preferred when the dataset contains outliers.
On the other hand, the mode identifies the most frequently occurring value and is particularly useful for understanding the most common category or value in categorical or discrete datasets. It’s especially handy when exploring initial properties of a dataset or when dealing with variables that have a limited number of distinct values.


