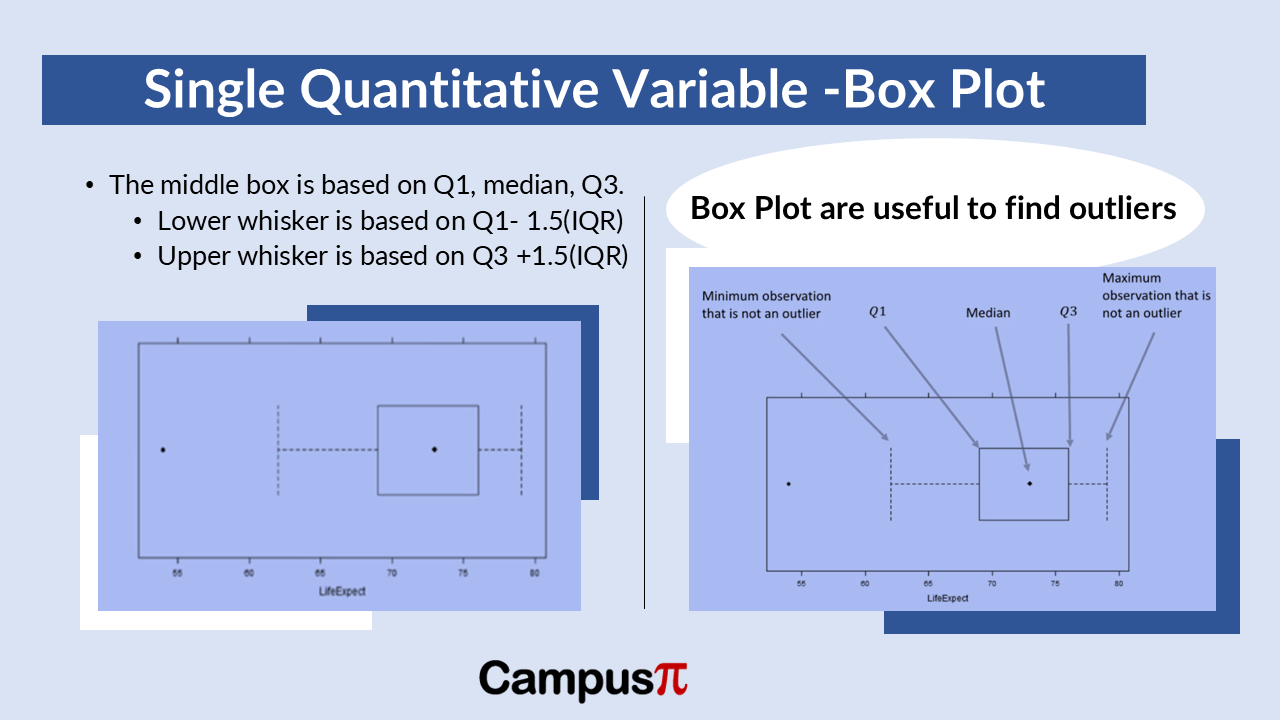
In a box plot, the “box” represents the interquartile range (IQR) of the data. Inside the box, you find the median (50th percentile) of the dataset. The “whiskers” extend from the box to show the range of the data excluding outliers, often defined as 1.5 times the IQR beyond the quartiles.
Box plot is alternative to a density plot or histogram to understand the distribution of a numerical variable, also known as a box-and-whisker plot. This type of plot is widely used in research to visualize data distributions.

In a box plot, the central box represents the interquartile range (IQR), which is a measure of statistical dispersion. This box is defined by the first quartile (25th percentile) and the third quartile (75th percentile) of the dataset. Inside the box, you’ll find a dot or line representing the median (50th percentile) of the data. This median indicates where half of the observations fall above and half below.
The whiskers extending from the box show the range of typical values in the dataset. The lower whisker extends to the smallest observation within 1.5 times the IQR below the first quartile. Similarly, the upper whisker extends to the largest observation within 1.5 times the IQR above the third quartile.
Box plots are valuable because they provide a concise summary of the data distribution, emphasizing key metrics like the median and quartiles while also identifying potential outliers beyond the whiskers.
In a box plot, the central box spans the interquartile range (IQR), containing the middle fifty percent of the data. At the center of this box lies the median, marked by a dot or line, indicating where half of the observations fall above and half below.
Extending from the box are whiskers that signify the typical range of values in the dataset. The lower whisker reaches to the smallest observation that isn’t considered an outlier, typically within 1.5 times the IQR below the first quartile. Conversely, the upper whisker stretches to the largest non-outlier observation within 1.5 times the IQR above the third quartile.
Box plots are effective for quickly grasping the spread and central tendency of data, while also identifying outliers—those data points that lie beyond the whiskers. In our Air Quality Index (AQI) example, a box plot might reveal a central box indicating where the majority of cities’ AQI values cluster, with whiskers extending to the typical range of AQI levels. If there’s an outlier, such as a city with extremely high AQI values, it would be visibly marked beyond the whiskers, highlighting it as an exceptional case.
Identifying Outliers

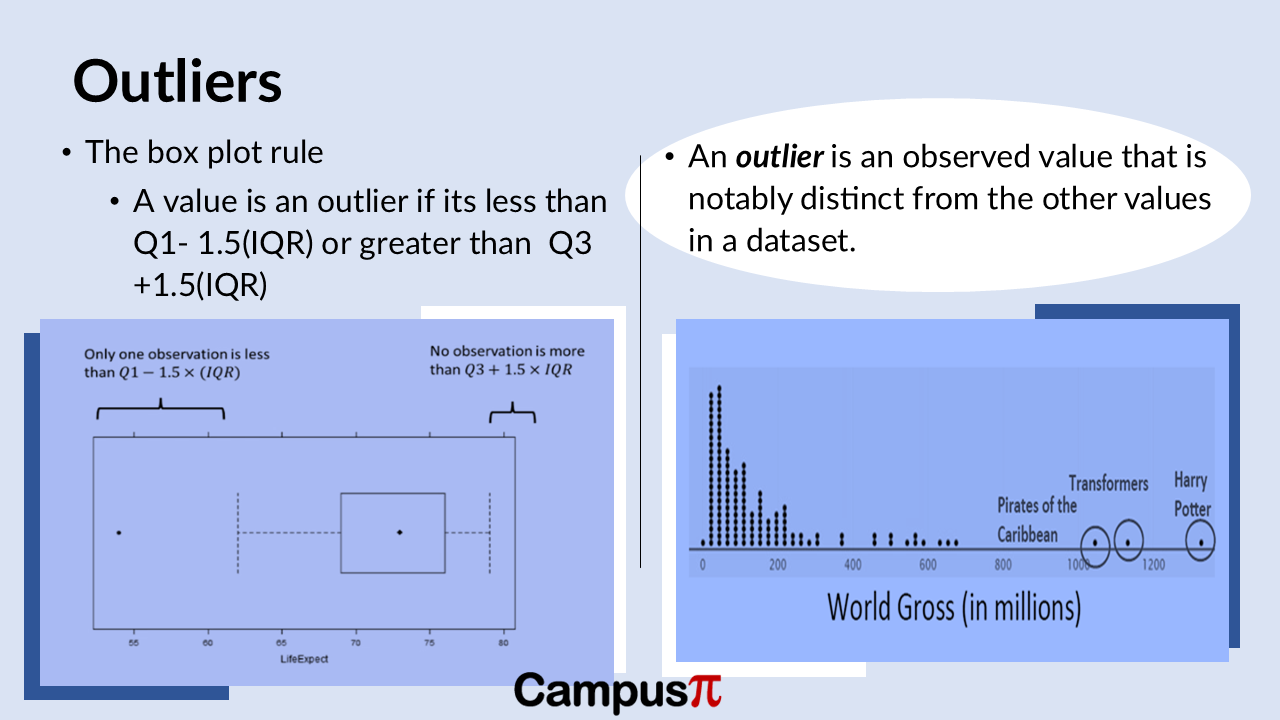
In the realm of data analysis, identifying outliers is crucial because they can signal potential errors or anomalies in the dataset. Outliers are data points that significantly deviate from the majority of observations, and they play a vital role in ensuring the accuracy and reliability of our analyses.
Imagine you’re examining a dataset of Air Quality Index (AQI) values across different cities. While most cities might show AQI levels within a certain range, an outlier could represent a city with an exceptionally high AQI value. This outlier might indicate a unique environmental condition or, potentially, an error in data recording.
The reason we pay close attention to outliers is their impact on summary statistics such as the mean, standard deviation, and variance. These measures are sensitive to extreme values—if an outlier isn’t identified and appropriately handled, it could skew our understanding of the dataset’s central tendency and variability.
To manage outliers effectively, one commonly used approach is the box plot rule, which helps in visually identifying data points that lie outside the typical range of observations. By systematically detecting and addressing outliers, researchers ensure their analyses are based on accurate, representative data, thereby avoiding misleading conclusions.


