In data analysis, identifying outliers with the box plot rule helps pinpoint data points that significantly deviate from the majority. Outliers represent extreme values that can skew numerical summaries like the mean, standard deviation, or variance, potentially misleading interpretations.
Skewness, closely related to outliers, refers to the asymmetry or lack of symmetry in a distribution. A skewed distribution tends to have a tail that extends more in one direction than the other. This directional emphasis indicates where outliers or extreme values are concentrated within the dataset.
Key Summary
- Skewness in distributions reflects where outliers or extreme values tend to cluster.
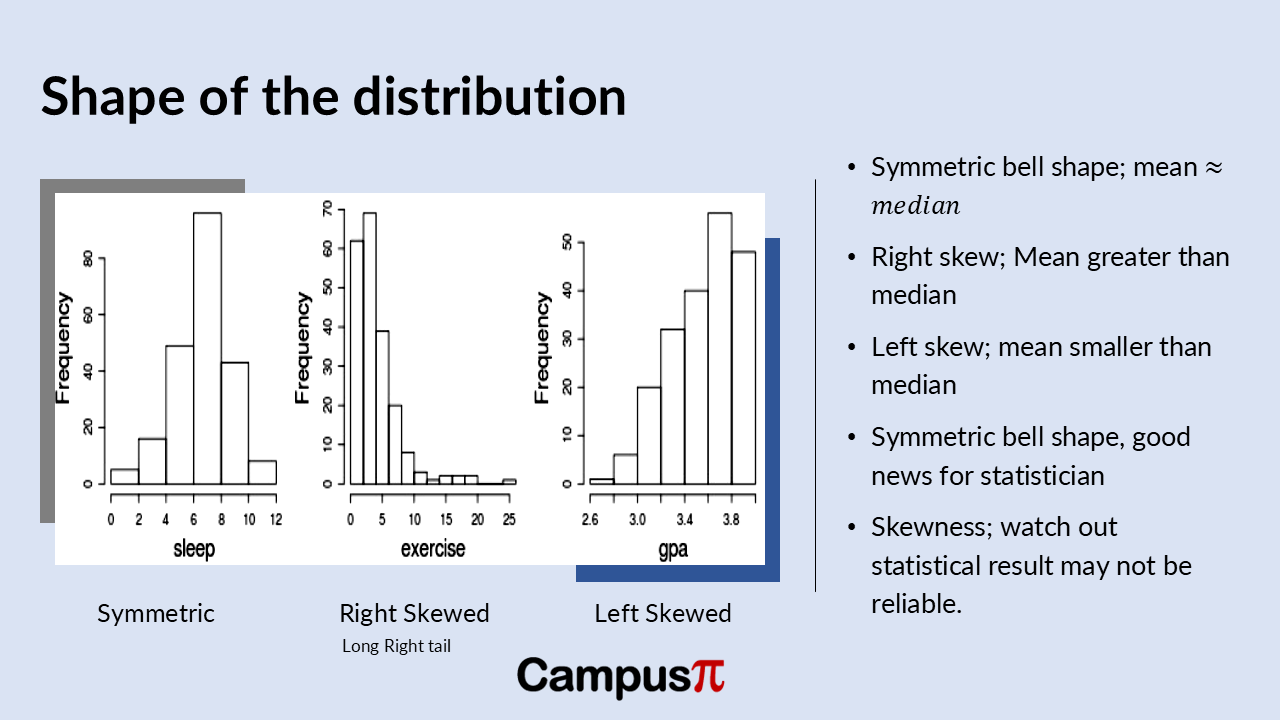
- When a distribution is symmetric, it means data points are evenly distributed around the mean, resulting in a balanced shape in histograms or density plots
- A skewed distribution tends to have a tail that extends more in one direction than the other.
- Left-skewed distributions have a longer tail on the left side, while right-skewed distributions have a longer tail on the right.
When a distribution is symmetric, it means data points are evenly distributed around the mean, resulting in a balanced shape in histograms or density plots. In contrast, left-skewed distributions have a longer tail on the left side, while right-skewed distributions have a longer tail on the right. These skewness patterns influence how we interpret data’s central tendency and spread, underscoring the importance of understanding distribution shapes to draw accurate conclusions from data analysis.

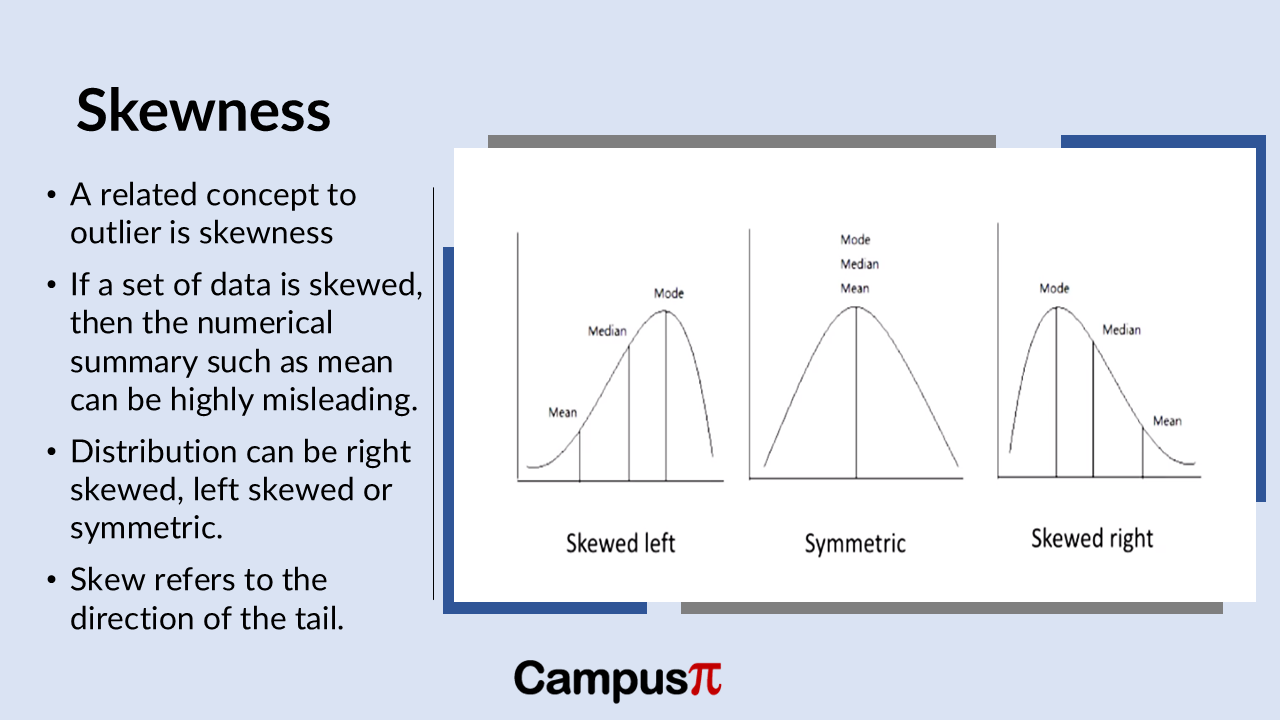
Skewness in distributions reflects where outliers or extreme values tend to cluster. A symmetric distribution shows a balanced spread of values around the mean, with no prominent skewness towards either end. Here, the mean, median, and mode is typically close in value.
In contrast, a left-skewed distribution features a longer tail on the left side, where fewer but extremely low values pull the mean towards them, away from the median and mode. This skewness suggests the data is concentrated towards higher values, with outliers predominantly on the lower end.

Conversely, a right-skewed distribution displays a longer tail on the right side, indicating more extreme high values that pull the mean in their direction, away from the median and mode. This skewness implies a dataset where outliers are mostly clustered at the higher end of the distribution. Understanding skewness helps analysts interpret data trends accurately, ensuring that summary statistics reflect the true central tendency and spread of the dataset.


