


Choosing which statistical test to use, given the variables is often confusing for researchers and analyst. One of the major factors that decides the choice of statistical test is dependent on the types of the variable we have at hand. We have discussed two types of variable numerical (quantitative) and categorical (qualitative) variable.
Key Summary
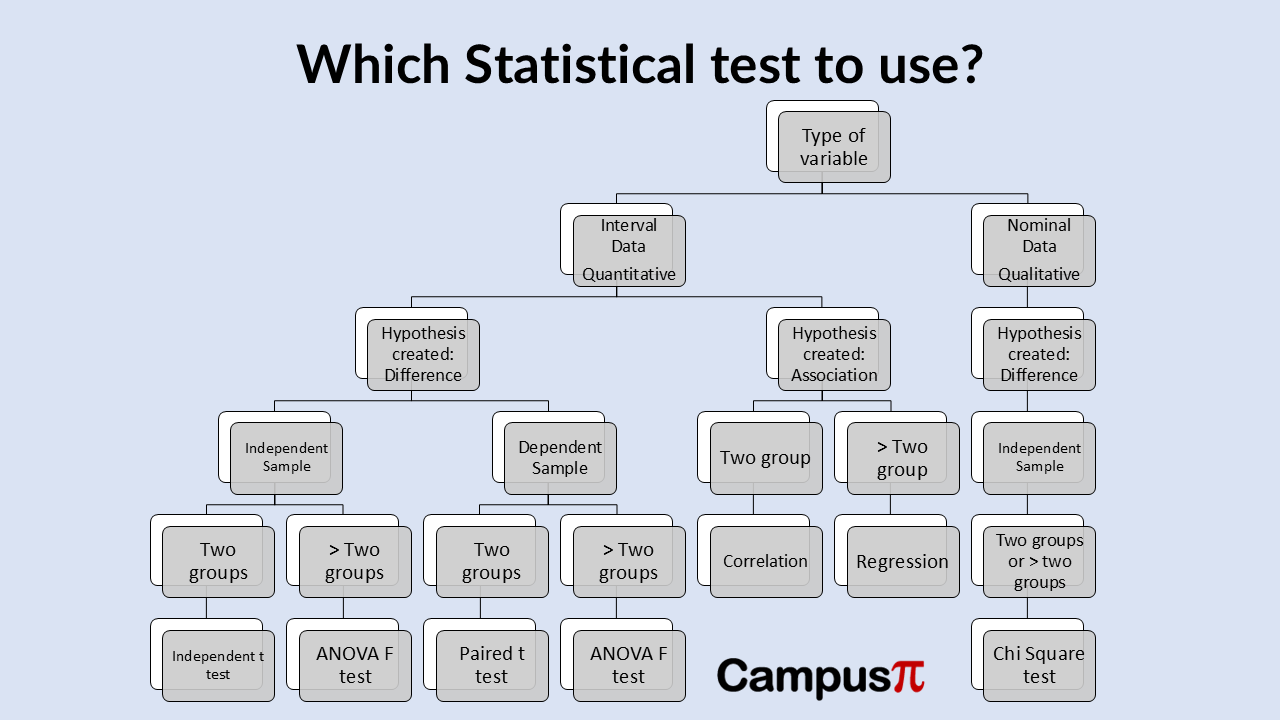
| Type of Test | Variables | Example |
| t-test (independent) | Numerical vs. Categorical (2 groups) | Exam scores of males vs. females |
| Paired t-test | Numerical vs. Categorical (paired) | Before-and-after blood pressure |
| ANOVA | Numerical vs. Categorical (3+ groups) | Different diets and weight loss |
| Pearson Correlation | Numerical vs. Numerical | Study hours vs. exam scores |
| Spearman Correlation | Ordinal/Numerical vs. Numerical | Satisfaction score vs. product price |
| Simple Linear Regression | Numerical vs. Numerical | Predict house price from square footage |
| Multiple Regression | Numerical vs. Multiple Predictors | Salary prediction based on experience, education |
| Chi-Square Test | Categorical vs. Categorical | Gender vs. Voting preference |
- Correlation – Numerical vs. Numerical
Pearson Correlation
Let’s say we have numerical data and we want to show the association between the two variables, then we use the correlation analysis. Correlation analysis helps in testing relationships between variables and is often used when determining whether variables are correlated or not.
We use person correlation when we want to measures the strength and direction of a linear relationship between two numerical variables. For example, if we want to measure, is there a relationship between hours studied and exam scores? Using correlation analysis, we can show that the numbers of hours studies is perfectly correlated with exam score using sample data collected on different individuals. We can draw a scatter plot where on X axis we have number of hours studied and on Y axis we have exam scores.
We also assume that the variable is normally distributed, and a linear relationship exist. Correlation always lies between -1 to 1, where -1 in our analysis will represent the exact non-linear relationship and 1 represents that both the variables are perfectly correlated.
Regression Analysis (Predicting Outcomes) – Numerical vs. Numerical
If we have more than two numerical variable and we want to predict the outcome of one variable from the other we use regression. For example, predicting house prices based on square footage. This is an example of Simple Linear Regression. Again, we use the same methodology used in correlation except we draw a line which help predicts the house prices based on square footage. The regression line drawn is key which will show the house prices based on different data of square footage.
Multiple linear regression is just a simple extension of simple linear regression, and in practice we always use multiple regression. While simple linear regression is used when we have two variables, multiple regression is used when we predict a numerical dependent variable using multiple numerical and/or categorical predictors. In case of multiple linear regression example could be predicting salary based on experience, education level, and location.
So, to sum up between correlation and regression, let’s take an example if we want to predict the height of employees in a company and their salary, we can do scatter plot to measure the association between the two variables using correlation. When we hypothesized that taller employees are paid more than the shorter employees, it makes sense to predict the salary using height we will use the linear regression.
- T test, F test or paired t test
Comparing Means (Numerical vs. Categorical Variable)
When we hypothesize there is a difference in average between groups, we can use t or F test. In this case, we can have two scenarios sample selection independent and sample selection dependent.
Paired t-test (Dependent t-test) – Numerical vs. Categorical (paired)
When we have dependent sample, which simply means that when we have two samples drawn on same individual in that case, we use paired t test or ANOVA (F test). Paired t test is used to compare means of two related groups (e.g., before and after). For example, does blood pressure decrease after taking a new medication? Here we have two samples on the same individual hence the samples are dependent.
Independent t-test (Two-Sample t-test) – Numerical vs. Categorical (2 groups)
When we have samples from different group of individuals, we use independent test or ANOVA (F test). Independent t test compares the difference in means between two groups that are independent of each other. Here, we are not measuring the same person before and after the treatment as in case of paired t test. We have independent observations and we are looking at the averages or mean. For example, if we want to measure, does the average test score differ between male and female students? We use independent t test. Here we have two different independent samples on male and female.
- ANOVA (Analysis of Variance) – Numerical vs. Categorical (3+ groups)
When we want to compare the means of three or more than three independent groups, we use ANOVA or F test. For example, if we consider, do different diets lead to different weight loss outcomes? Here we can see that the diets could be more than three and we measure the weight loss due to different diets used.
- Chi Square test -Comparing Proportions/Frequencies – Categorical vs. Categorical
When our primary interest is categorical, we use chi square test. It is used when testing relationships between categorical variables. It helps us determines whether two categorical variables are associated? For example, if we consider is there a relationship between gender and voting preference? We use Chi square test, as both the variables here is categorical. We can also use test of proportion when we have categorical data.
Comments are closed.